
Other Weekly Reports
IE Weekly Enrollment - Global Campus Weekly Enrollment - Graduate Studies Weekly Enrollment
Welcome to the weekly reports focused on undergraduate applications, admissions and orientation registrations.
Within each week's summary, you will see a link to several standard reports.
Admissions reporting is based on data snapshots taken each Wednesday night and reported on Thursdays.
- Fall semester reports will begin in early October and run through the week prior to the start of the the fall semester.
- Winter semester reports will begin in early October and run through the week prior to the start of the winter semester.
Undergraduate Application Reports: April 18, 2024 Fall
Undergraduate Application Reports: April 18, 2024
Fall 2024
Hello, Everyone,
Happy NMU Giving Day!
Please feel free to share these with your NMU colleagues and reach out with any questions (x2221 or kproehl@nmu.edu).
You may view current and archived reports here: WeeklyEnrollment Reporting.
- These numbers include Global Campus students and international students.
- New this cycle: We will show application count totals in the narrative, and also break out the counts for campus-based (non-Global Campus) applications. This will help us track our progress on initiatives that are designed to impact the campus-based first-year and transfer populations.
Fall 2024 - Comparing April 19, 2023 to April 17, 2024
First-year/Freshman applications: 11,908 (+5200; +78% compared to the same point in time for Fall 2023)
Campus-based applications: 11,736; 98.5% of total. [Fall 2023: 98.1% of total at this point in time]
First-year/Freshman admissions: 9986 (+5412; +118%) compared to the same point in time for Fall 2023)
First-year/Freshman orientation registrations: 1051 (+58; +5.8%) Added 70 this week.
Transfer applications: 876 (+46; +6%) compared to the same point in time for Fall 2023)
Campus-based applications: 742; 84.7% of total. [Fall 2023: 88% of total at this point in time]
Transfer admissions: 462 (+28; +6%) compared to the same point in time for Fall 2023)
Transfer orientation registrations: 185 (+32; +20.9%) Added 7 this week.
Multi-year view:
| Fall 2017: 4/19/17 | Fall 2018: 4/25/18 | Fall 2019: 4/24/19 | Fall 2020: 4/22/20 | Fall 2021: 4/21/21 | Fall 2022: 4/20/22 | Fall 2023 4/19/23 | Fall 2024 4/18/24 | |
| Freshman Applications | 6032 | 7502 | 7562 | 6066 | 6367 | 6058 | 6708 | 11908 |
| Freshman Admits | 4354 | 4826 | 4876 | 3992 | 4458 | 4235 | 4574 | 9986 |
| % incomplete apps -F | 26% | 33% | 33% | 33% | 29% | 29% | 31% | 15% |
| Freshman Orientation Reg | 783 | 908 | 1031 | 833 | 1014 | 886 | 993 | 1051 |
| % of admits reg for orientation | 18.0% | 18.8% | 21.1% | 20.9% | 22.7% | 20.9% | 21.7% | 10.5% |
| % of final fall reg for orientation | 52.2% | 56.5% | 64.4% | 61.5% | 68.0% | 63.0% | 64.3% | |
| Final Yield - % of admits enrolled | 33% | 32% | 32% | 32% | 32% | 32% | 32% | |
| New Freshman fall enrollment | 1501 | 1608 | 1601 | 1354 | 1491 | 1407 | 1542 | |
| Transfer Applications | 847 | 1217 | 1061 | 883 | 842 | 855 | 830 | 876 |
| Transfer Admits | 431 | 546 | 496 | 451 | 471 | 470 | 434 | 462 |
| % incomplete apps -T | 47% | 52% | 51% | 47% | 40% | 43% | 44% | 44% |
| Transfer Orientation Reg | 129 | 174 | 175 | 151 | 167 | 173 | 153 | 185 |
| % of admits reg for orientation | 29.9% | 31.9% | 35.3% | 33.5% | 35.5% | 36.8% | 35.3% | 40.0% |
| % of final fall reg for orientation | 31.7% | 35.7% | 41.8% | 38.4% | 46.4% | 44.8% | 34.7% | |
| Final Yield - % of admits enrolled | 61% | 61% | 60% | 56% | 54% | 55% | 56% | |
| Transfer fall enrollment | 407 | 488 | 419 | 393 | 360 | 386 | 440 | |
| Point-in-Cycle - New Freshmen | Fall 2017 | Fall 2018 | Fall 2019 | Fall 2020 | Fall 2021 | Fall 2022 | Fall 2023 | Fall 2024 |
| Final total fall freshman apps | 6345 | 7791 | 7837 | 6389 | 6693 | 6340 | 7063 | |
| % of total fall freshman apps received as of this date | 95% | 96% | 96% | 94.9% | 95.1% | 95.6% | 94.9% | |
| Final total fall freshman admits | 4591 | 5001 | 5035 | 4169 | 4670 | 4386 | 4848 | |
| % of total freshman fall admits received as of this date | 95% | 97% | 97% | 95.8% | 95.5% | 96.6% | 94.0% | |
| Point-in-Cycle - Transfers | Fall 2017 | Fall 2018 | Fall 2019 | Fall 2020 | Fall 2021 | Fall 2022 | Fall 2023 | Fall 2024 |
| Final total fall transfer apps | 1173 | 1574 | 1363 | 1229 | 1169 | 1216 | 1371 | |
| % of total fall transfer apps received as of this date | 72% | 77% | 78% | 71.8% | 72.0% | 70.3% | 60.5% | |
| Final total fall transfer admits | 668 | 801 | 702 | 701 | 672 | 700 | 787 | |
| % of total fall transfer admits received as of this date | 65% | 68% | 71% | 64.3% | 70.0% | 67.1% | 55.1% | |
| FAFSA switched to 10/1 in 2016 for those applying for fall 2017; College app/FAFSA access initiatives increased in MI in 2018-19 | First able to advertise and admit to MEDP in summer 2017 for fall 2017 | Full marketing & appl cycle for MEDP | First fall with test blind policy fully adopted | July 1, 2023 - Eliminated application fee; joined Common App for 2024 freshman apps. FAFSA delayed cycle January - April |
Even More Indicators:
Gains in housing deposits are still significant compared to this time last year.
2023: 1017 total housing applications, 869 submitted advanced payments = 85%.
2024: 1082 total housing applications (gained +34 over last week), 880 submitted advanced payments = 81.3%
+65 registrations over last year. As a reminder, students do pay the $50 application fee and if they choose, the $200 advanced payment when registering for housing, but it is fully refundable until May 1.
Of the 1082 students who have registered for housing, 76.2% have also registered for orientation.
194 students have started the orientation registration process but have not hit submit, 53 of these students have registered for housing.
Currently, NMU has received 3,299 FAFSA’s from actively admitted students. This is +312 over last year. The financial aid office is processing FAFSA’s as quickly as possible. Some students will need to make corrections to their FAFSA, some are waiting for corrections from the Department of Education and some will receive their financial aid eligibility shortly. NMU is communicating to all of these students to make them aware of where they are in the process and what needs to happen to determine their aid eligibility as quickly as possible.
As always, our goal is clear, ongoing, consistent communication with incoming students and their families as we navigate this interesting cycle.
Thanks for all you do!
Kari
| Kari Garcia Pronouns: she/her Director of Admissions | Admissions Office Northern Michigan University Direct: 906-227-2221 | Admissions: 1-800-682-9797 1401 Presque Isle Ave, Marquette, MI 49855 nmu.edu/admissions kproehl@nmu.edu Northern Michigan University is located on the ancestral homelands of the Anishinaabe, Three Fires Confederacy, an honored alliance of the Ojibwe, Odawa, and Bodewadmik (Potowatomi) peoples. |
Undergraduate Application Reports: April 11, 2024 Fall
Undergraduate Application Reports: April 11, 2024
Fall 2024
Hello, Everyone,
It's a bit of a long app report today -- but some things are just too exciting not to share!
Please feel free to share these with your NMU colleagues and reach out with any questions (x2221 or kproehl@nmu.edu).
You may view current and archived reports here: WeeklyEnrollment Reporting.
- These numbers include Global Campus students and international students.
- New this cycle: We will show application count totals in the narrative, and also break out the counts for campus-based (non-Global Campus) applications. This will help us track our progress on initiatives that are designed to impact the campus-based first-year and transfer populations.
Fall 2024 - Comparing April 12, 2023 to April 10, 2024
First-year/Freshman applications: 11,857 (+5192; +78% compared to the same point in time for Fall 2023)
Campus-based applications: 11,688; 98.5% of total. [Fall 2023: 98.2% of total at this point in time]
First-year/Freshman admissions: 9948 (+5400; +119%) compared to the same point in time for Fall 2023)
First-year/Freshman orientation registrations: 981 (+49; +5.3%) Added 57 this week.
Transfer applications: 855 (+49; +6%) compared to the same point in time for Fall 2023)
Campus-based applications: 724; 84.6% of total. [Fall 2023: 88.3% of total at this point in time]
Transfer admissions: 451 (+19; +5%) compared to the same point in time for Fall 2023)
Transfer orientation registrations: 178 (+35; +24.5%) Added 13 this week.
Multi-year view:
| Fall 2017: 4/12/17 | Fall 2018: 4/18/18 | Fall 2019: 4/17/19 | Fall 2020: 4/15/20 | Fall 2021: 4/14/21 | Fall 2022: 4/13/22 | Fall 2023 4/12/23 | Fall 2024 4/11/24 | |
| Freshman Applications | 6006 | 7471 | 7527 | 6021 | 6328 | 6033 | 6665 | 11,857 |
| Freshman Admits | 4331 | 4789 | 4855 | 3909 | 4432 | 4213 | 4548 | 9948 |
| % incomplete apps -F | 26% | 33% | 33% | 34% | 29% | 29% | 30% | 15% |
| Freshman Orientation Reg | 706 | 839 | 966 | 774 | 971 | 838 | 932 | 981 |
| % of admits reg for orientation | 16.3% | 17.5% | 20.0% | 19.8% | 21.9% | 19.9% | 20.5% | 9.8% |
| % of final fall reg for orientation | 47.0% | 52.2% | 60.3% | 57.2% | 65.1% | 59.6% | 60.4% | |
| Final Yield - % of admits enrolled | 33% | 32% | 32% | 32% | 32% | 32% | 32% | |
| New Freshman fall enrollment | 1501 | 1608 | 1601 | 1354 | 1491 | 1407 | 1542 | |
| Transfer Applications | 822 | 1192 | 1039 | 861 | 812 | 830 | 806 | 855 |
| Transfer Admits | 418 | 525 | 487 | 428 | 457 | 457 | 419 | 451 |
| % incomplete apps -T | 47% | 53% | 51% | 48% | 40% | 43% | 45% | 45% |
| Transfer Orientation Reg | 113 | 158 | 162 | 137 | 154 | 152 | 143 | 178 |
| % of admits reg for orientation | 27.0% | 30.1% | 33.3% | 32.0% | 33.7% | 33.3% | 34.1% | 39.4% |
| % of final fall reg for orientation | 27.8% | 32.4% | 38.7% | 34.9% | 42.8% | 39.4% | 32.5% | |
| Final Yield - % of admits enrolled | 61% | 61% | 60% | 56% | 54% | 55% | 56% | |
| Transfer fall enrollment | 407 | 488 | 419 | 393 | 360 | 386 | 440 | |
| Point-in-Cycle - New Freshmen | Fall 2017 | Fall 2018 | Fall 2019 | Fall 2020 | Fall 2021 | Fall 2022 | Fall 2023 | Fall 2024 |
| Final total fall freshman apps | 6345 | 7791 | 7837 | 6389 | 6693 | 6340 | 7063 | |
| % of total fall freshman apps received as of this date | 94.7% | 95.9% | 96.0% | 94.2% | 94.5% | 95.2% | 94.3% | |
| Final total fall freshman admits | 4591 | 5001 | 5035 | 4169 | 4670 | 4386 | 4848 | |
| % of total freshman fall admits received as of this date | 94.3% | 95.8% | 96.4% | 93.8% | 94.9% | 96.1% | 93.8% | |
| Point-in-Cycle - Transfers | Fall 2017 | Fall 2018 | Fall 2019 | Fall 2020 | Fall 2021 | Fall 2022 | Fall 2023 | Fall 2024 |
| Final total fall transfer apps | 1173 | 1574 | 1363 | 1229 | 1169 | 1216 | 1371 | |
| % of total fall transfer apps received as of this date | 70.1% | 75.7% | 76.2% | 70.1% | 69.5% | 68.3% | 58.7% | |
| Final total fall transfer admits | 668 | 801 | 702 | 701 | 672 | 700 | 787 | |
| % of total fall transfer admits received as of this date | 62.6% | 65.5% | 69.4% | 61.1% | 68.0% | 65.3% | 53.2% | |
| FAFSA switched to 10/1 in 2016 for those applying for fall 2017; College app/FAFSA access initiatives increased in MI in 2018-19 | First able to advertise and admit to MEDP in summer 2017 for fall 2017 | Full marketing & appl cycle for MEDP | First fall with test blind policy fully adopted | July 1, 2023 - Eliminated application fee; joined Common App for 2024 freshman apps. FAFSA delayed cycle January - April |
A few things to note:
Gains in housing deposits are still significant compared to this time last year.
2023: 977 total housing applications, 825 submitted advanced payments = 84%.
2024: 1048 total housing applications (gained +31 over last week), 850 submitted advanced payments = 81.1%
+71 registrations over last year. As a reminder, students do pay the $50 application fee and if they choose, the $200 advanced payment when registering for housing, but it is fully refundable until May 1.
Of the 1048 students who have registered for housing, 74.1% have also registered for orientation.
221 students have started the orientation registration process but have not hit submit, 58 of these students have registered for housing.
FAFSA Update:
FAFSA’s are FINALLY rolling in which gives us another indicator to share. Currently, NMU has received 3,212 FAFSA’s from actively admitted students. This is +287 over last year.
A few things as we look at this number and the chart below. The percentage of active admit FAFSA’s received is much lower than last year, but that’s because we have an increased active admit pool due our surge in apps and admits this year from joining the Common App. However, the actual number of FAFSA’s submitted from active admits is almost 300 higher than last year at this time! That’s significant, especially as the national narrative suggests that FAFSA submissions are down overall across the country.
Cool Event Alert: Admissions and the Alumni office teamed up this year with a SISU grant aimed at providing events for admitted students, alumni, current students and admissions staff. These events, held across the country, are aimed at providing a casual space for admitted students to get to know NMU and meet others who are thinking about attending as well.
Last night, NMU hosted an event at Top Golf in Auburn Hills. 15 prospective students and their families attended (5 who have not registered for orientation), along with 4 NMU alumni. The night was filled with so many great conversations.
One conversation in particular stood out between Kim Randolph, NMU's Regional Admissions counselor in Detroit and a prospective student who has not registered for orientation, “I spoke for a long time with the family of a student who had not registered for orientation. She is currently undecided but has been visiting a LOT of schools and still gathering information before making a decision. Northern made the initial cut, but then fell off the radar for a while. After visiting some other schools, she's realizing that NMU might be a great fit after all so we have risen back to the top of her list. They made a comment that they have attended events for other colleges that were similar in concept to ours, but we did it the BEST because there were no boring/repetitive presentations and that Emma and I had the time to sit down, visit, and really talk through things with folks individually. They really, really appreciated that approach!”
Thanks to SISU for providing the grant and Nichole Braska (Admissions) and Robyn Stille (Alumni) for your proposal and organization of the grant. As you can see, it’s providing one more tool in the toolbox to connect prospective students to NMU.
Thanks for all you do!
Kari
| Kari Garcia Pronouns: she/her Director of Admissions | Admissions Office Northern Michigan University Direct: 906-227-2221 | Admissions: 1-800-682-9797 1401 Presque Isle Ave, Marquette, MI 49855 nmu.edu/admissions kproehl@nmu.edu Northern Michigan University is located on the ancestral homelands of the Anishinaabe, Three Fires Confederacy, an honored alliance of the Ojibwe, Odawa, and Bodewadmik (Potowatomi) peoples |
Undergraduate Application Reports, April 4, 2024 Fall
Undergraduate Application Reports: April 4, 2024
Fall 2024
Hello, Everyone,
Happy Snow Day! It’s also app report day – isn't it fun that they fall on the same day.
Please feel free to share these with your NMU colleagues and reach out with any questions (x2221 or kproehl@nmu.edu).
You may view current and archived reports here: WeeklyEnrollment Reporting.
- These numbers include Global Campus students and international students.
- New this cycle: We will show application count totals in the narrative, and also break out the counts for campus-based (non-Global Campus) applications. This will help us track our progress on initiatives that are designed to impact the campus-based first-year and transfer populations.
Fall 2024 - Comparing April 5, 2023 to April 3, 2024
First-year/Freshman applications: 11,786 (+5150; +78% compared to the same point in time for Fall 2023)
Campus-based applications: 11,621; 98.6% of total. [Fall 2023: 98.2% of total at this point in time]
First-year/Freshman admissions: 9883 (+5365; +119%) compared to the same point in time for Fall 2023)
First-year/Freshman orientation registrations: 924 (+51; +5.8%) Added 57 this week.
Transfer applications: 819 (+35; +4%) compared to the same point in time for Fall 2023)
Campus-based applications: 697; 85.1% of total. [Fall 2023: 88.9% of total at this point in time]
Transfer admissions: 441 (+30; +7%) compared to the same point in time for Fall 2023)
Transfer orientation registrations: 165 (+39; +31%) Added 18 this week.
Multi-year view:
| Fall 2017 4/5/17 | Fall 2018 4/11/18 | Fall 2019 4/10/19 | Fall 2020 4/8/20 | Fall 2021 4/7/21 | Fall 2022 4/6/22 | Fall 2023 4/5/23 | Fall 2024 4/3/24 | |
| Freshman Applications | 5974 | 7425 | 7494 | 5978 | 6284 | 6005 | 6636 | 11,786 |
| Freshman Admits | 4299 | 4768 | 4822 | 3874 | 4405 | 4196 | 4518 | 9883 |
| % incomplete apps -F | 26% | 33% | 33% | 34% | 29% | 29% | 31% | 15% |
| Freshman Orientation Reg | 632 | 750 | 905 | 738 | 901 | 791 | 873 | 924 |
| % of admits reg for orientation | 14.7% | 15.7% | 18.8% | 19.1% | 20.5% | 18.9% | 19.3% | 9.3% |
| % of final fall reg for orientation | 42.1% | 46.6% | 56.5% | 54.5% | 60.4% | 56.2% | 56.6% | |
| Final Yield - % of admits enrolled | 33% | 32% | 32% | 32% | 32% | 32% | 32% | |
| New Freshman fall enrollment | 1501 | 1608 | 1601 | 1354 | 1491 | 1407 | 1542 | |
| Transfer Applications | 808 | 1153 | 1021 | 826 | 789 | 812 | 784 | 819 |
| Transfer Admits | 403 | 516 | 468 | 420 | 447 | 440 | 411 | 441 |
| % incomplete apps -T | 48% | 52% | 52% | 47% | 40% | 44% | 44% | 43% |
| Transfer Orientation Reg | 99 | 145 | 146 | 124 | 140 | 138 | 126 | 165 |
| % of admits reg for orientation | 24.6% | 28.1% | 31.2% | 29.5% | 31.3% | 31.4% | 30.7% | 37.4% |
| % of final fall reg for orientation | 24.3% | 29.7% | 34.8% | 31.6% | 38.9% | 35.8% | 28.6% | |
| Final Yield - % of admits enrolled | 61% | 61% | 60% | 56% | 54% | 55% | 56% | |
| Transfer fall enrollment | 407 | 488 | 419 | 393 | 360 | 386 | 440 | |
| Point-in-Cycle - New Freshmen | Fall 2017 | Fall 2018 | Fall 2019 | Fall 2020 | Fall 2021 | Fall 2022 | Fall 2023 | Fall 2024 |
| Final total fall freshman apps | 6345 | 7791 | 7837 | 6389 | 6693 | 6340 | 7063 | |
| % of total fall freshman apps received as of this date | 94.2% | 95.3% | 95.6% | 93.6% | 93.9% | 94.7% | 93.9% | |
| Final total fall freshman admits | 4591 | 5001 | 5035 | 4169 | 4670 | 4386 | 4848 | |
| % of total freshman fall admits received as of this date | 93.6% | 95.3% | 95.8% | 92.9% | 94.3% | 95.7% | 93.1% | |
| Point-in-Cycle - Transfers | Fall 2017 | Fall 2018 | Fall 2019 | Fall 2020 | Fall 2021 | Fall 2022 | Fall 2023 | Fall 2024 |
| Final total fall transfer apps | 1173 | 1574 | 1363 | 1229 | 1169 | 1216 | 1371 | |
| % of total fall transfer apps received as of this date | 68.9% | 73.3% | 74.9% | 67.2% | 67.5% | 66.8% | 57.1% | |
| Final total fall transfer admits | 668 | 801 | 702 | 701 | 672 | 700 | 787 | |
| % of total fall transfer admits received as of this date | 60.3% | 64.4% | 66.7% | 59.9% | 66.5% | 62.9% | 52.2% | |
| FAFSA switched to 10/1 in 2016 for those applying for fall 2017; College app/FAFSA access initiatives increased in MI in 2018-19 | First able to advertise and admit to MEDP in summer 2017 for fall 2017 | Full marketing & appl cycle for MEDP | First fall with test blind policy fully adopted | July 1, 2023 - Eliminated application fee; joined Common App for 2024 freshman apps. FAFSA delayed cycle January - March |
A few things to note:
Gains in housing deposits are still significant compared to this time last year.
2023: 983 total housing applications, 779 submitted advanced payments = 79%.
2024: 1017 total housing applications (gained +26 over last week), 826 submitted advanced payments = 81.2%
+34 registrations over last year. As a reminder, students do pay the $50 application fee and if they choose, the $200 advanced payment when registering for housing, but it is fully refundable until May 1.
Of the 1017 students who have registered for housing, 71.7% have also registered for orientation.
207 students have started the orientation registration process but have not hit submit, 54 of these students have registered for housing.
Biggest gains in orientation registrations for first year students are in the U.P. and our national markets (beyond our Midwest states).
Biggest gains in orientation registrations for transfer students are in lower Michigan.
Financial Aid is aiming for the week of April 15 for the first batch of financial aid notices to be available to incoming students. Stay tuned for some shifting in the funnel over the next month.
Thanks for all you do!
Kari
| Kari Garcia Pronouns: she/her Director of Admissions | Admissions Office Northern Michigan University Direct: 906-227-2221 | Admissions: 1-800-682-9797 1401 Presque Isle Ave, Marquette, MI 49855 nmu.edu/admissions kproehl@nmu.edu Northern Michigan University is located on the ancestral homelands of the Anishinaabe, Three Fires Confederacy, an honored alliance of the Ojibwe, Odawa, and Bodewadmik (Potowatomi) peoples. |
Undergraduate Application Reports: March 28, 2024 Fall
Undergraduate Application Reports: March 28, 2024
Fall 2024
Hello, Everyone,
If you've noticed a few really large groups of prospective students and families touring around campus this week, or you've noticed a few more campus visitors on your schedule, you're not alone. Just this week, we've hosted 140 campus visitors and their families. Thanks for your support!
Please feel free to share these with your NMU colleagues and reach out with any questions (x2221 or kproehl@nmu.edu).
You may view current and archived reports here: WeeklyEnrollment Reporting.
- These numbers include Global Campus students and international students.
- New this cycle: We will show application count totals in the narrative, and also break out the counts for campus-based (non-Global Campus) applications. This will help us track our progress on initiatives that are designed to impact the campus-based first-year and transfer populations.
Fall 2024 - Comparing March 29, 2023 to March 27, 2024
First-year/Freshman applications: 11,726 (+5127; +78% compared to the same point in time for Fall 2023)
Campus-based applications: 11,564; 98.6% of total. [Fall 2023: 98.2% of total at this point in time]
First-year/Freshman admissions: 9847 (+5360; +119%) compared to the same point in time for Fall 2023)
First-year/Freshman orientation registrations: 867 (+43; +5.2%) Added 36 this week.
Transfer applications: 802 (+39; +5%) compared to the same point in time for Fall 2023)
Campus-based applications: 683; 85.1% of total. [Fall 2023: 89.1% of total at this point in time]
Transfer admissions: 425 (+28; +7%) compared to the same point in time for Fall 2023)
Transfer orientation registrations: 147 (+32; +27.8%) Added 13 this week.
Multi-year view:
| Fall 2017 3/29/17 | Fall 2018 4/4/18 | Fall 2019 4/3/19 | Fall 2020 4/1/20 | Fall 2021 3/31/21 | Fall 2022 3/30/22 | Fall 2023 3/29/23 | Fall 2024 3/27/24 | |
| Freshman Applications | 5923 | 7395 | 7463 | 5948 | 6242 | 5965 | 6599 | 11,726 |
| Freshman Admits | 4263 | 4743 | 4797 | 3848 | 4382 | 4174 | 4487 | 9847 |
| % incomplete apps -F | 26% | 33% | 33% | 34% | 29% | 29% | 31% | 15% |
| Freshman Orientation Reg | 588 | 676 | 830 | 700 | 852 | 747 | 824 | 867 |
| % of admits reg for orientation | 13.8% | 14.3% | 17.3% | 18.2% | 19.4% | 17.9% | 18.4% | 8.8% |
| % of final fall reg for orientation | 39.2% | 42.0% | 51.8% | 51.7% | 57.1% | 53.1% | 53% | |
| Final Yield - % of admits enrolled | 33% | 32% | 32% | 32% | 32% | 32% | 32% | |
| New Freshman fall enrollment | 1501 | 1608 | 1601 | 1354 | 1491 | 1407 | 1542 | |
| Transfer Applications | 785 | 1130 | 991 | 794 | 767 | 792 | 763 | 802 |
| Transfer Admits | 385 | 501 | 452 | 404 | 433 | 420 | 397 | 425 |
| % incomplete apps -T | 48% | 52% | 53% | 47% | 40% | 45% | 45% | 45% |
| Transfer Orientation Reg | 81 | 126 | 121 | 119 | 126 | 124 | 115 | 147 |
| % of admits reg for orientation | 21.0% | 25.1% | 26.8% | 29.5% | 29.1% | 29.5% | 29.0% | 34.5% |
| % of final fall reg for orientation | 19.9% | 25.8% | 28.9% | 30.3% | 35.0% | 32.1% | 26.0% | |
| Final Yield - % of admits enrolled | 61% | 61% | 60% | 56% | 54% | 55% | 56% | |
| Transfer fall enrollment | 407 | 488 | 419 | 393 | 360 | 386 | 440 | |
| Point-in-Cycle - New Freshmen | Fall 2017 | Fall 2018 | Fall 2019 | Fall 2020 | Fall 2021 | Fall 2022 | Fall 2023 | Fall 2024 |
| Final total fall freshman apps | 6345 | 7791 | 7837 | 6389 | 6693 | 6340 | 7063 | |
| % of total fall freshman apps received as of this date | 93.3% | 94.9% | 95.2% | 93.1% | 93.3% | 94.1% | 93.4% | |
| Final total fall freshman admits | 4591 | 5001 | 5035 | 4169 | 4670 | 4386 | 4848 | |
| % of total freshman fall admits received as of this date | 92.9% | 94.8% | 95.3% | 92.3% | 93.8% | 95.2% | 92.5% | |
| Point-in-Cycle - Transfers | Fall 2017 | Fall 2018 | Fall 2019 | Fall 2020 | Fall 2021 | Fall 2022 | Fall 2023 | Fall 2024 |
| Final total fall transfer apps | 1173 | 1574 | 1363 | 1229 | 1169 | 1216 | 1371 | |
| % of total fall transfer apps received as of this date | 66.9% | 71.8% | 72.7% | 64.6% | 65.6% | 65.1% | 55.6% | |
| Final total fall transfer admits | 668 | 801 | 702 | 701 | 672 | 700 | 787 | |
| % of total fall transfer admits received as of this date | 57.6% | 62.5% | 64.4% | 57.6% | 64.4% | 60.0% | 50.4% | |
| FAFSA switched to 10/1 in 2016 for those applying for fall 2017; College app/FAFSA access initiatives increased in MI in 2018-19 | First able to advertise and admit to MEDP in summer 2017 for fall 2017 | Full marketing & appl cycle for MEDP | First fall with test blind policy fully adopted | July 1, 2023 - Eliminated application fee; joined Common App for 2024 freshman apps. FAFSA delayed cycle January - March |
A few things to note:
Gains in housing deposits are still significant compared to this time last year.
2023: 893 total housing applications, 737 submitted advanced payments = 82%.
2024: 991 total housing applications (gained +42 over last week), 802 submitted advanced payments = 80%
+98 registrations over last year. As a reminder, students do pay the $50 application fee and if they choose, the $200 advanced payment when registering for housing, but it is fully refundable until May 1.
Of the 991 students who have registered for housing, 68% have also registered for orientation.
207 students have started the orientation registration process but have not hit submit, 58 of these students have registered for housing.
Even though Wildcat Weekend has passed, campus visits continue to trend upward.
This week alone, we’ve hosted 140 campus visitors and their families (it’s spring break for many high schools.) Over the course of the next month we will continue to see increases in campus visits, with 44 already planned and more requests coming in each day. Thanks in advance for all you do to support the Campus Visit Program.
On another note, you may have heard that Northland College in Ashland, WI, https://www.northland.edu/ is having financial trouble and is on the brink of closing. We’ll know more on April 3; however, we have set up a website for Northland College students, nmu.edu/admissions/northlandcollege with information on academic programs and transfer scholarships. If you talk with any students from Northland College interested in NMU, feel free to pass along the site and connect students with Admissions for more information.
Thank you,
Kari
| Kari Garcia Pronouns: she/her Director of Admissions | Admissions Office Northern Michigan University Direct: 906-227-2221 | Admissions: 1-800-682-9797 1401 Presque Isle Ave, Marquette, MI 49855 nmu.edu/admissions kproehl@nmu.edu Northern Michigan University is located on the ancestral homelands of the Anishinaabe, Three Fires Confederacy, an honored alliance of the Ojibwe, Odawa, and Bodewadmik (Potowatomi) peoples. |
Undergraduate Application Reports: March 21, 2024
Undergraduate Application Reports: March 21, 2024
Fall 2024
Hello, Everyone,
Please feel free to share these with your NMU colleagues and reach out with any questions (x2221 or kproehl@nmu.edu).
You may view current and archived reports here: WeeklyEnrollment Reporting.
- These numbers include Global Campus students and international students.
- New this cycle: We will show application count totals in the narrative, and also break out the counts for campus-based (non-Global Campus) applications. This will help us track our progress on initiatives that are designed to impact the campus-based first-year and transfer populations.
Fall 2024 - Comparing March 22, 2023 to March 20, 2024
First-year/Freshman applications: 11,659 (+5107; +78% compared to the same point in time for Fall 2023)
Campus-based applications: 11,502; 98.6% of total. [Fall 2023: 98.2% of total at this point in time]
First-year/Freshman admissions: 9797 (+5336; +120%) compared to the same point in time for Fall 2023)
First-year/Freshman orientation registrations: 831 (+39; +5%)
Transfer applications: 779 (+47; +6%) compared to the same point in time for Fall 2023)
Campus-based applications: 669; 85.8% of total. [Fall 2023: 89.4% of total at this point in time]
Transfer admissions: 408 (+30; +8%) compared to the same point in time for Fall 2023)
Transfer orientation registrations: 134 (+31; +30.1%)
--If you attended the university forum yesterday, you heard me say that we had an increase of +115 orientation registrations this week, that number included summer term and was pulled directly from the orientation registration system vs. the numbers in this report are from a snapshot taken yesterday and only include Fall term, so they may differ slightly. It's all about the timing of when reports are captured, and there is so much movement in the funnel right now.
Either way, we had a significant increase in orientation registrations since the event, and 6 students even registered DURING the event!
Multi-year view:
| Fall 2017 3/22/17 | Fall 2018 3/28/18 | Fall 2019 3/27/19 | Fall 2020 3/25/20 | Fall 2021 3/24/21 | Fall 2022 3/23/22 | Fall 2023 3/22/23 | Fall 2024 3/20/24 | |
| Freshman Applications | 5885 | 7359 | 7417 | 5926 | 6215 | 5930 | 6552 | 11,659 |
| Freshman Admits | 4240 | 4717 | 4751 | 3831 | 4350 | 4146 | 4461 | 9797 |
| % incomplete apps -F | 26% | 33% | 33% | 34% | 29% | 29% | 31% | 15% |
| Freshman Orientation Reg | 542 | 636 | 760 | 659 | 820 | 716 | 782 | 831 |
| % of admits reg for orientation | 12.8% | 13.5% | 16.0% | 17.2% | 18.9% | 17.3% | 17.5% | 8.4% |
| % of final fall reg for orientation | 36.1% | 39.6% | 47.5% | 48.7% | 55.0% | 50.9% | 50.0% | |
| Final Yield - % of admits enrolled | 33% | 32% | 32% | 32% | 32% | 32% | 32% | |
| New Freshman fall enrollment | 1501 | 1608 | 1601 | 1354 | 1491 | 1407 | 1542 | |
| Transfer Applications | 762 | 1100 | 966 | 768 | 752 | 756 | 732 | 779 |
| Transfer Admits | 360 | 488 | 423 | 392 | 412 | 401 | 378 | 408 |
| % incomplete apps -T | 50% | 52% | 55% | 37% | 41% | 45% | 45% | 45% |
| Transfer Orientation Reg | 66 | 103 | 97 | 111 | 111 | 115 | 103 | 134 |
| % of admits reg for orientation | 18.3% | 21.1% | 22.9% | 28.3% | 26.9% | 28.7% | 27.2% | 32.0% |
| % of final fall reg for orientation | 16.2% | 21.1% | 23.2% | 28.2% | 30.8% | 29.8% | 23.0% | |
| Final Yield - % of admits enrolled | 61% | 61% | 60% | 56% | 54% | 55% | 56% | |
| Transfer fall enrollment | 407 | 488 | 419 | 393 | 360 | 386 | 440 | |
| Point-in-Cycle - New Freshmen | Fall 2017 | Fall 2018 | Fall 2019 | Fall 2020 | Fall 2021 | Fall 2022 | Fall 2023 | Fall 2024 |
| Final total fall freshman apps | 6345 | 7791 | 7837 | 6389 | 6693 | 6340 | 7063 | |
| % of total fall freshman apps received as of this date | 92.8% | 94.5% | 94.6% | 92.8% | 92.9% | 93.5% | 92.7% | |
| Final total fall freshman admits | 4591 | 5001 | 5035 | 4169 | 4670 | 4386 | 4848 | |
| % of total freshman fall admits received as of this date | 92.4% | 94.3% | 94.4% | 91.9% | 93.1% | 94.5% | 91.0% | |
| Point-in-Cycle - Transfers | Fall 2017 | Fall 2018 | Fall 2019 | Fall 2020 | Fall 2021 | Fall 2022 | Fall 2023 | Fall 2024 |
| Final total fall transfer apps | 1173 | 1574 | 1363 | 1229 | 1169 | 1216 | 1371 | |
| % of total fall transfer apps received as of this date | 65.0% | 69.9% | 70.9% | 62.5% | 64.3% | 62.2% | 53.3% | |
| Final total fall transfer admits | 668 | 801 | 702 | 701 | 672 | 700 | 787 | |
| % of total fall transfer admits received as of this date | 53.9% | 60.9% | 60.3% | 55.9% | 61.3% | 57.2% | 48.0% | |
| FAFSA switched to 10/1 in 2016 for those applying for fall 2017; College app/FAFSA access initiatives increased in MI in 2018-19 | First able to advertise and admit to MEDP in summer 2017 for fall 2017 | Full marketing & appl cycle for MEDP | First fall with test blind policy fully adopted | July 1, 2023 - Eliminated application fee; joined Common App for 2024 freshman apps. FAFSA delayed cycle January - March |
A few things to note:
Gains in housing deposits are still significant compared to this time last year.
2023: 854 total housing applications, 697 submitted advanced payments = 81%.
2024: 949 total housing applications (gained +51 over last week), 766 submitted advanced payments = 80%
+95 registrations over last year. As a reminder, students do pay the $50 application fee and if they choose, the $200 advanced payment when registering for housing, but it is fully refundable until May 1.
Of the 949 students who have registered for housing, 67% have also registered for orientation.
216 students have started the orientation registration process but have not hit submit, 56 of these students have registered for housing.
Wildcat Weekend was a huge success, and campus showed up in a big way! Thank you!
Here are the numbers from the weekend:
Total number of students attended - 304
Total number of students + guests - 754
We had students attend from 14 different states including: Connecticut, Florida, Iowa, Illinois, Indiana, Massachusetts, Michigan, Minnesota, Missouri, Nebraska, New Hampshire, Ohio, Texas and Wisconsin!!
Here are a few highlights:
“Wildcat Weekend was great! It made me feel better and less nervous about being away from home and I’m a lot more confident about moving on to college.”
“Thank you so much for helping us through WW. I think it was a great event and we got a great perception of what NMU was like. The boys really enjoyed it! Thank you to everyone for their hard work making it such a success! All the students and staff involved were quite incredible...Everyone did a great job. I thought that it was amazing when one of my kids commented on the fact that it was so well organized and well planned.”
"After the wonderful experience at wildcat weekend I have decided Northern Michigan is the place for me."
Thanks,
Kari
| Kari Garcia Pronouns: she/her Director of Admissions | Admissions Office Northern Michigan University Direct: 906-227-2221 | Admissions: 1-800-682-9797 1401 Presque Isle Ave, Marquette, MI 49855 nmu.edu/admissions kproehl@nmu.edu Northern Michigan University is located on the ancestral homelands of the Anishinaabe, Three Fires Confederacy, an honored alliance of the Ojibwe, Odawa, and Bodewadmik (Potowatomi) peoples. |
Undergraduate Application Reports, March 14, 2024 Fall
|
Undergraduate Application Reports: March 7, 2024
Undergraduate Application Reports: March 7, 2024
Fall 2024
Hello, Everyone,
Please feel free to share these with your NMU colleagues and reach out with any questions (x2221 or kproehl@nmu.edu).
You may view current and archived reports here: WeeklyEnrollment Reporting.
- These numbers include Global Campus students and international students.
- New this cycle: We will show application count totals in the narrative, and also break out the counts for campus-based (non-Global Campus) applications. This will help us track our progress on initiatives that are designed to impact the campus-based first-year and transfer populations.
Fall 2024 - Comparing March 8, 2023 to March 6, 2024
First-year/Freshman applications: 11,515 (+5066; +79% compared to the same point in time for Fall 2023)
Campus-based applications: 11,362; 98.6% of total. [Fall 2023: 98% of total at this point in time]
First-year/Freshman admissions:9689 (+5310; +121%) compared to the same point in time for Fall 2023)
First-year/Freshman orientation registrations: 733 (+25; +3.5%)
Transfer applications: 706 (+39; +6% compared to the same point in time for Fall 2023)
Campus-based applications: 608; 86.1% of total. [Fall 2023: 89.8% of total at this point in time]
Transfer admissions: 364 (+22; +6% compared to the same point in time for Fall 2023)
Transfer orientation registrations: 112 (+28; +33.3%)
Multi-year view:
| Fall 2017: 3/8/17 | Fall 2018: 3/14/18 | Fall 2019: 3/13/19 | Fall 2020: 3/11/20 | Fall 2021: 3/10/21 | Fall 2022: 3/9/22 | Fall 2023 3/8/23 | Fall 2024 3/7/24 | |
| Freshman Applications | 5778 | 7262 | 7323 | 5860 | 6113 | 5867 | 6449 | 11,515 |
| Freshman Admits | 4160 | 4643 | 4674 | 3786 | 4256 | 4082 | 4379 | 9689 |
| % incomplete apps -F | 26% | 34% | 33% | 34% | 30% | 30% | 31% | 15% |
| Freshman Orientation Reg | 459 | 523 | 683 | 605 | 703 | 617 | 708 | 733 |
| % of admits reg for orientation | 11.0% | 11.3% | 14.6% | 16.0% | 16.5% | 15.1% | 16.2% | 7.5% |
| % of final fall reg for orientation | 30.6% | 35.2% | 42.7% | 44.7% | 47.1% | 43.9% | 45.0% | |
| Final Yield - % of admits enrolled | 33% | 32% | 32% | 32% | 32% | 32% | 32% | |
| New Freshman fall enrollment | 1501 | 1608 | 1601 | 1354 | 1491 | 1407 | 1542 | |
| Transfer Applications | 688 | 1036 | 900 | 725 | 701 | 711 | 667 | 706 |
| Transfer Admits | 321 | 437 | 377 | 364 | 377 | 379 | 342 | 364 |
| % incomplete apps -T | 51% | 55% | 57% | 48% | 42% | 44% | 46% | 45% |
| Transfer Orientation Reg | 45 | 79 | 58 | 98 | 84 | 95 | 84 | 112 |
| % of admits reg for orientation | 14.0% | 18.1% | 15.4% | 26.9% | 22.3% | 25.1% | 24.6% | 30.7% |
| % of final fall reg for orientation | 11.1% | 16.2% | 13.8% | 24.9% | 23.3% | 24.6% | 19.0% | |
| Final Yield - % of admits enrolled | 61% | 61% | 60% | 56% | 54% | 55% | 56% | |
| Transfer fall enrollment | 407 | 488 | 419 | 393 | 360 | 386 | 440 | |
| Point-in-Cycle - New Freshmen | Fall 2017 | Fall 2018 | Fall 2019 | Fall 2020 | Fall 2021 | Fall 2022 | Fall 2023 | Fall 2024 |
| Final total fall freshman apps | 6345 | 7791 | 7837 | 6389 | 6693 | 6340 | 7063 | |
| % of total fall freshman apps received as of this date | 91.1% | 93.2% | 93.4% | 91.7% | 91.3% | 92.5% | 91.3% | |
| Final total fall freshman admits | 4591 | 5001 | 5035 | 4169 | 4670 | 4386 | 4848 | |
| % of total freshman fall admits received as of this date | 90.6% | 92.8% | 92.8% | 90.8% | 91.1% | 93.1% | 90.3% | |
| Point-in-Cycle - Transfers | Fall 2017 | Fall 2018 | Fall 2019 | Fall 2020 | Fall 2021 | Fall 2022 | Fall 2023 | Fall 2024 |
| Final total fall transfer apps | 1173 | 1574 | 1363 | 1229 | 1169 | 1216 | 1371 | |
| % of total fall transferapps received as of this date | 58.7% | 65.8% | 66.0% | 59.0% | 60.0% | 58.5% | 48.6% | |
| Final total fall transfer admits | 668 | 801 | 702 | 701 | 672 | 700 | 787 | |
| % of total fall transferadmits received as of this date | 48.1% | 54.6% | 53.7% | 51.9% | 56.1% | 54.1% | 43.4% | |
| FAFSA switched to 10/1 in 2016 for those applying for fall 2017; College app/FAFSA access initiatives increased in MI in 2018-19 | First able to advertise and admit to MEDP in summer 2017 for fall 2017 | Full marketing & appl cycle for MEDP | First fall with test blind policy fully adopted | July 1, 2023 - Eliminated application fee; joined Common App for 2024 freshman apps. FAFSA delayed cycle January - March |
A few things to note:
Gains in housing deposits are still significant compared to this time last year.
2023: 767 total housing applications, 604 submitted advanced payments = 78%.
2024: 862 total housing applications, 681 submitted advanced payments = 79%
+95 registrations over last year. As a reminder, students do pay the $50 application fee and if they choose, the $200 advanced payment when registering for housing, but it is fully refundable until May 1.
Of the 862 students who have registered for housing, 66% have also registered for orientation.
188 students have started the orientation registration process but have not hit submit, 49 of these students have registered for housing.
We are seeing a nice boost in transfer orientation numbers. This could be due to a few things including a post COVID boost as students who opted for community college during COVID are now transferring to 4-year institutions, the deferred orientation registration fee and our use of Transferology – a national transfer credit platform, creating more visibility.
93 of the 112 transfer orientation registrations plan to be on-campus students.
Thanks,
Kari
Undergraduate Application Reports: February 29, 2024
Undergraduate Application Reports: February 29, 2024
Fall 2024
Hello, Everyone,
Happy Leap Day! And Happy App Report Day!
Please feel free to share these with your NMU colleagues and reach out with any questions (x2221 or kproehl@nmu.edu).
You may view current and archived reports here: WeeklyEnrollment Reporting.
- These numbers include Global Campus students and international students.
- New this cycle: We will show application count totals in the narrative, and also break out the counts for campus-based (non-Global Campus) applications. This will help us track our progress on initiatives that are designed to impact the campus-based first-year and transfer populations.
Fall 2024 - Comparing March 1, 2023 to February 28, 2024
First-year/Freshman applications: 11,397 (+5001; +78% compared to the same point in time for Fall 2023)
Campus-based applications: 11,245; 98.6% of total. [Fall 2023: 98% of total at this point in time]
First-year/Freshman admissions: 9571 (+5250; +121%) compared to the same point in time for Fall 2023)
First-year/Freshman orientation registrations: 690 (+10; +1.5%)
Transfer applications: 673 (+38; +6% compared to the same point in time for Fall 2023)
Campus-based applications: 580; 86.1% of total. [Fall 2023: 90.7% of total at this point in time]
Transfer admissions: 349 (+20; +6% compared to the same point in time for Fall 2023)
Transfer orientation registrations: 105 (+25; +31.3%)
Multi-year view:
| Fall 2017: 3/8/17 | Fall 2018: 3/7/18 | Fall 2019: 3/6/19 | Fall 2020: 3/4/20 | Fall 2021: 3/3/21 | Fall 2022: 3/2/22 | Fall 2023 3/1/23 | Fall 2024 2/29/24 | |
| Freshman Applications | 5778 | 7205 | 7258 | 5816 | 6065 | 5826 | 6396 | 11397 |
| Freshman Admits | 4160 | 4579 | 4605 | 3764 | 4196 | 4040 | 4321 | 9571 |
| % incomplete apps -F | 26% | 34% | 34% | 34% | 30% | 30% | 32% | 15% |
| Freshman Orientation Reg | 459 | 473 | 648 | 575 | 647 | 579 | 680 | 690 |
| % of admits reg for orientation | 11.0% | 10.3% | 14.1% | 15.3% | 15.4% | 14.3% | 15.7% | 7.2% |
| % of final fall reg for orientation | 30.6% | 29.4% | 40.5% | 42.5% | 43.4% | 41.2% | 44.0% | |
| Final Yield - % of admits enrolled | 33% | 32% | 32% | 32% | 32% | 32% | 32% | |
| New Freshman fall enrollment | 1501 | 1608 | 1601 | 1354 | 1491 | 1407 | 1542 | |
| Transfer Applications | 688 | 1009 | 863 | 705 | 672 | 684 | 635 | 673 |
| Transfer Admits | 321 | 416 | 354 | 353 | 359 | 360 | 329 | 349 |
| % incomplete apps -T | 51% | 56% | 57% | 48% | 43% | 45% | 45% | 46% |
| Transfer Orientation Reg | 45 | 71 | 42 | 80 | 77 | 85 | 80 | 105 |
| % of admits reg for orientation | 14.0% | 17.1% | 11.9% | 22.7% | 21.4% | 23.6% | 24.3% | 30.0% |
| % of final fall reg for orientation | 11.1% | 14.5% | 10.0% | 20.4% | 21.4% | 22.0% | 18.0% | |
| Final Yield - % of admits enrolled | 61% | 61% | 60% | 56% | 54% | 55% | 56% | |
| Transfer fall enrollment | 407 | 488 | 419 | 393 | 360 | 386 | 440 | |
| Point-in-Cycle - New Freshmen | Fall 2017 | Fall 2018 | Fall 2019 | Fall 2020 | Fall 2021 | Fall 2022 | Fall 2023 | Fall 2024 |
| Final total fall freshman apps | 6345 | 7791 | 7837 | 6389 | 6693 | 6340 | 7063 | |
| % of total fall freshman apps received as of this date | 91.1% | 92.5% | 92.6% | 91.0% | 90.6% | 91.9% | 90.5% | |
| Final total fall freshman admits | 4591 | 5001 | 5035 | 4169 | 4670 | 4386 | 4848 | |
| % of total freshman fall admits received as of this date | 90.6% | 91.6% | 91.5% | 90.3% | 89.9% | 92.1% | 89.1% | |
| Point-in-Cycle - Transfers | Fall 2017 | Fall 2018 | Fall 2019 | Fall 2020 | Fall 2021 | Fall 2022 | Fall 2023 | Fall 2024 |
| Final total fall transfer apps | 1173 | 1574 | 1363 | 1229 | 1169 | 1216 | 1371 | |
| % of total fall transfer apps received as of this date | 58.7% | 64.1% | 63.3% | 57.4% | 57.5% | 56.3% | 46.3% | |
| Final total fall transfer admits | 668 | 801 | 702 | 701 | 672 | 700 | 787 | |
| % of total fall transfer admits received as of this date | 48.1% | 51.9% | 50.4% | 50.4% | 53.4% | 51.4% | 41.8% | |
| FAFSA switched to 10/1 in 2016 for those applying for fall 2017; College app/FAFSA access initiatives increased in MI in 2018-19 | First able to advertise and admit to MEDP in summer 2017 for fall 2017 | Full marketing & appl cycle for MEDP | First fall with test blind policy fully adopted | July 1, 2023 - Eliminated application fee; joined Common App for 2024 freshman apps. FAFSA delayed cycle January - March |
A few things to note:
Gains in housing deposits are still significant compared to this time last year.
2023: 720 total housing applications, 559 submitted advanced payments = 77%.
2024: 827 total housing applications, 653 submitted advanced payments = 78%
+107 registrations over last year. As a reminder, students do pay the $50 application fee and if they choose, the $200 advanced payment when registering for housing, but it is fully refundable until May 1.
Of the 827 students who have registered for housing, 64% have also registered for orientation.
193 students have started the orientation registration process but have not hit submit, 50 of these students have registered for housing.
The NMU Admissions team is out in full force this March with 173 events scheduled in 12 states including MI, IL, MN, WI, OH, IN, CA, CO, NY, TX, WA and FL. Plus, Wildcat Weekend, with over 290 students registered so far.
Phew…if you see an admissions counselor out and about, they may be in need of caffeine!
Thanks,
Kari
| Kari Garcia Pronouns: she/her Director of Admissions | Admissions Office Northern Michigan University Direct: 906-227-2221 | Admissions: 1-800-682-9797 1401 Presque Isle Ave, Marquette, MI 49855 nmu.edu/admissions kproehl@nmu.edu Northern Michigan University is located on the ancestral homelands of the Anishinaabe, Three Fires Confederacy, an honored alliance of the Ojibwe, Odawa, and Bodewadmik (Potowatomi) peoples. |
Undergraduate Application Reports: February 22, 2024 Fall 2024
Undergraduate Application Reports: February 22, 2024
Fall 2024
Hello, Everyone,
Did you know today is National Chili Day and National Cook a Sweet Potato Day -- you're welcome for the dinner tips. :)
And now onto the weekly app reports.
Please feel free to share these with your NMU colleagues and reach out with any questions (x2221 or kproehl@nmu.edu).
You may view current and archived reports here: WeeklyEnrollment Reporting.
- These numbers include Global Campus students and international students.
- New this cycle: We will show application count totals in the narrative, and also break out the counts for campus-based (non-Global Campus) applications. This will help us track our progress on initiatives that are designed to impact the campus-based first-year and transfer populations.
Fall 2024 - Comparing February 22, 2023 to February 21, 2024
First-year/Freshman applications: 11,329 (+4989; +79% compared to the same point in time for Fall 2023)
Campus-based applications: 11,181; 98.6% of total. [Fall 2023: 98% of total at this point in time]
First-year/Freshman admissions: 9523 (+5242; +122%) compared to the same point in time for Fall 2023)
First-year/Freshman orientation registrations: 650(+7; +1.1%)
Transfer applications: 655 (+37; +6% compared to the same point in time for Fall 2023)
Campus-based applications: 565; 86.2% of total. [Fall 2023: 91% of total at this point in time]
Transfer admissions: 329 (+11; +3% compared to the same point in time for Fall 2023)
Transfer orientation registrations: 95 (+17; +21%)
Multi-year view:
| Fall 2017 2/22/17 | Fall 2018 2/28/18 | Fall 2019 2/27/19 | Fall 2020 2/26/20 | Fall 2021 2/24/21 | Fall 2022 2/23/22 | Fall 2023 2/22/23 | Fall 2024 2/21/24 | |
| Freshman Applications | 5648 | 7161 | 7208 | 5766 | 5978 | 5754 | 6340 | 11329 |
| Freshman Admits | 4024 | 4543 | 4548 | 3719 | 4139 | 3986 | 4281 | 9523 |
| % incomplete apps -F | 27% | 34% | 34% | 34% | 30% | 30% | 32% | 15% |
| Freshman Orientation Reg | 350 | 419 | 600 | 525 | 611 | 523 | 643 | 650 |
| % of admits reg for orientation | 8.7% | 9.2% | 13.2% | 14.1% | 14.8% | 13.1% | 15.0% | 6.8% |
| % of final fall reg for orientation | 23.0% | 26.1% | 37.5% | 38.8% | 41.0% | 37.2% | 41.6% | |
| Final Yield - % of admits enrolled | 33% | 32% | 32% | 32% | 32% | 32% | 32% | |
| New Freshman fall enrollment | 1501 | 1608 | 1601 | 1354 | 1491 | 1407 | 1542 | |
| Transfer Applications | 644 | 981 | 834 | 667 | 649 | 649 | 618 | 655 |
| Transfer Admits | 286 | 402 | 340 | 340 | 341 | 337 | 318 | 329 |
| % incomplete apps -T | 53% | 56% | 58% | 47% | 44% | 46% | 46% | 47% |
| Transfer Orientation Reg | 28 | 55 | 37 | 68 | 71 | 75 | 78 | 95 |
| % of admits reg for orientation | 9.9% | 13.7% | 10.9% | 20.0% | 20.8% | 22.3% | 24.5% | 28.0% |
| % of final fall reg for orientation | 6.9% | 11.3% | 8.8% | 17.3% | 19.7% | 19.4% | 17.7% | |
| Final Yield - % of admits enrolled | 61% | 61% | 60% | 56% | 54% | 55% | 56% | |
| Transfer fall enrollment | 407 | 488 | 419 | 393 | 360 | 386 | 440 | |
| Point-in-Cycle - New Freshmen | Fall 2017 | Fall 2018 | Fall 2019 | Fall 2020 | Fall 2021 | Fall 2022 | Fall 2023 | Fall 2024 |
| Final total fall freshman apps | 6345 | 7791 | 7837 | 6389 | 6693 | 6340 | 7063 | |
| % of total fall freshman apps received as of this date | 89.0% | 91.9% | 92.5% | 90.2% | 89.3% | 90.8% | 89.0% | |
| Final total fall freshman admits | 4591 | 5001 | 5035 | 4169 | 4670 | 4386 | 4848 | |
| % of total freshman fall admits received as of this date | 87.6% | 90.8% | 90.3% | 89.2% | 88.6% | 90.9% | 88.3% | |
| Point-in-Cycle - Transfers | Fall 2017 | Fall 2018 | Fall 2019 | Fall 2020 | Fall 2021 | Fall 2022 | Fall 2023 | Fall 2024 |
| Final total fall transfer apps | 1173 | 1574 | 1363 | 1229 | 1169 | 1216 | 1371 | |
| % of total fall transfer apps received as of this date | 54.9% | 62.3% | 61.2% | 54.3% | 55.5% | 53.4% | 45.0% | |
| Final total fall transfer admits | 668 | 801 | 702 | 701 | 672 | 700 | 787 | |
| % of total fall transfer admits received as of this date | 42.8% | 50.2% | 48.4% | 48.5% | 50.7% | 48.1% | 40.4% | |
| FAFSA switched to 10/1 in 2016 for those applying for fall 2017; College app/FAFSA access initiatives increased in MI in 2018-19 | First able to advertise and admit to MEDP in summer 2017 for fall 2017 | Full marketing & appl cycle for MEDP | First fall with test blind policy fully adopted | July 1, 2023 - Eliminated application fee; joined Common App for 2024 freshman apps. FAFSA delayed cycle January - March |
A few things to note:
Gains in housing deposits are still significant compared to this time last year.
2023: 662 total housing applications, 512 submitted advanced payments = 77%.
2024: 785 total housing applications, 617 submitted advanced payments = 78%
+123 registrations over last year. As a reminder, students do pay the $50 application fee and if they choose, the $200 advanced payment when registering for housing, but it is fully refundable until May 1.
Of the 785 students who have registered for housing, 62% have also registered for orientation.
190 students have started the orientation registration process but have not hit submit, 50 of these students have registered for housing.
What does this all mean? That there will be a lot of movement over the next few months and even more movement once Financial Aid notices are available, so we'll be watching everything very closely.
In the meantime, Wildcat Weekend is March 15–16, 2024 and we have 247 students registered as of today, with 160 admitted for Fall 2024 and only 42 of the 160 are registered for orientation. This number will climb as we get close to the event, but as always, the March Wildcat Weekend presents great opportunity! You can find more info on the schedule here, https://nmu.edu/admissions/wildcatweekend. So far, we have students registered from CT, DE, FL, IA, IL, IN, MI, MN, MO, NE, NH, NY, OH, TX and WI. Thank you for all you do to support Wildcat Weekend.
That’s it for today, enjoy the sunshine!
Please reach out with questions, happy to help.
Kari
| Kari Garcia Pronouns: she/her Director of Admissions | Admissions Office Northern Michigan University Direct: 906-227-2221 | Admissions: 1-800-682-9797 1401 Presque Isle Ave, Marquette, MI 49855 nmu.edu/admissions kproehl@nmu.edu Northern Michigan University is located on the ancestral homelands of the Anishinaabe, Three Fires Confederacy, an honored alliance of the Ojibwe, Odawa, and Bodewadmik (Potowatomi) peoples. |
Fall 2024 Weekly Application Reports - February 15, 2024
Undergraduate Application Reports: February 15, 2024
Fall 2024
Hello, Everyone,
Here are your weekly app reports.
Please feel free to share these with your NMU colleagues and reach out with any questions (x2221 or kproehl@nmu.edu).
You may view current and archived reports here: WeeklyEnrollment Reporting.
- These numbers include Global Campus students and international students.
- New this cycle: We will show application count totals in the narrative, and also break out the counts for campus-based (non-Global Campus) applications. This will help us track our progress on initiatives that are designed to impact the campus-based first-year and transfer populations.
Fall 2024 - Comparing February 15, 2023 to February 14, 2024
First-year/Freshman applications: 11,245 (+5198; +79% compared to the same point in time for Fall 2023)
Campus-based applications: 11,101; 98.7% of total. [Fall 2023: 97% of total at this point in time]
First-year/Freshman admissions: 9448 (+5198; +122%) compared to the same point in time for Fall 2023)
First-year/Freshman orientation registrations: 596(-10; -1.7%)
Transfer applications: 630 (+35; +6% compared to the same point in time for Fall 2023)
Campus-based applications: 543; 86.1% of total. [Fall 2023: 91% of total at this point in time]
Transfer admissions: 312 (+7; +2% compared to the same point in time for Fall 2023)
Transfer orientation registrations: 87 (+16; +22%)
Multi-year view:
| Fall 2017 2/15/17 | Fall 2018 2/21/18 | Fall 2019 2/20/19 | Fall 2020 2/19/20 | Fall 2021 2/17/21 | Fall 2022 2/16/22 | Fall 2023 2/15/23 | Fall 2024 2/14/24 | |
| Freshman Applications | 5576 | 7070 | 7131 | 5707 | 5914 | 5711 | 6287 | 11,245 |
| Freshman Admits | 3956 | 4492 | 4500 | 3660 | 4067 | 3951 | 4250 | 9448 |
| % incomplete apps -F | 27% | 34% | 34% | 35% | 31% | 30% | 32% | 15% |
| Freshman Orientation Reg | 325 | 372 | 553 | 480 | 568 | 482 | 606 | 596 |
| % of admits reg for orientation | 8.20% | 8.30% | 12.30% | 13.10% | 14.00% | 12.20% | 14.30% | 6.30% |
| % of final fall reg for orientation | 21.70% | 23.10% | 34.50% | 35.50% | 38.10% | 34.30% | 39.20% | |
| Final Yield - % of admits enrolled | 33% | 32% | 32% | 32% | 32% | 32% | 32% | |
| New Freshman fall enrollment | 1501 | 1608 | 1601 | 1354 | 1491 | 1407 | 1542 | |
| Transfer Applications | 620 | 937 | 805 | 648 | 621 | 629 | 595 | 630 |
| Transfer Admits | 268 | 391 | 325 | 326 | 326 | 325 | 303 | 312 |
| % incomplete apps -T | 54% | 55% | 58% | 48% | 44% | 47% | 46% | 48% |
| Transfer Orientation Reg | 23 | 50 | 30 | 58 | 62 | 64 | 71 | 87 |
| % of admits reg for orientation | 8.90% | 12.80% | 9.20% | 17.80% | 19.00% | 19.70% | 23.40% | 27.80% |
| % of final fall reg for orientation | 5.70% | 10.20% | 7.20% | 14.80% | 17.20% | 16.60% | 16.10% | |
| Final Yield - % of admits enrolled | 61% | 61% | 60% | 56% | 54% | 55% | 56% | |
| Transfer fall enrollment | 407 | 488 | 419 | 393 | 360 | 386 | 440 | |
| Point-in-Cycle - New Freshmen | Fall 2017 | Fall 2018 | Fall 2019 | Fall 2020 | Fall 2021 | Fall 2022 | Fall 2023 | Fall 2024 |
| Final total fall freshman apps | 6345 | 7791 | 7837 | 6389 | 6693 | 6340 | 7063 | |
| % of total fall freshman apps received as of this date | 87.90% | 90.70% | 91.00% | 89.30% | 83.40% | 90.10% | 89% | |
| Final total fall freshman admits | 4591 | 5001 | 5035 | 4169 | 4670 | 4386 | 4848 | |
| % of total freshman fall admits received as of this date | 86.20% | 89.90% | 89.40% | 87.80% | 87.10% | 90.10% | 87.60% | |
| Point-in-Cycle - Transfers | Fall 2017 | Fall 2018 | Fall 2019 | Fall 2020 | Fall 2021 | Fall 2022 | Fall 2023 | Fall 2024 |
| Final total fall transfer apps | 1173 | 1574 | 1363 | 1229 | 1169 | 1216 | 1371 | |
| % of total fall transfer apps received as of this date | 52.90% | 59.50% | 59.10% | 52.70% | 53.10% | 51.70% | 43.30% | |
| Final total fall transfer admits | 668 | 801 | 702 | 701 | 672 | 700 | 787 | |
| % of total fall transfer admits received as of this date | 40.10% | 48.80% | 46.30% | 46.50% | 48.50% | 46.40% | 38% | |
| FAFSA switched to 10/1 in 2016 for those applying for fall 2017; College app/FAFSA access initiatives increased in MI in 2018-19 | First able to advertise and admit to MEDP in summer 2017 for fall 2017 | Full marketing & appl cycle for MEDP | First fall with test blind policy fully adopted | July 1, 2023 - Eliminated application fee; joined Common App for 2024 freshman apps. FAFSA delayed cycle, January – March |
A few things to note:
I’ve been digging into a lot of data lately and here are a few interesting facts about this applicant pool so far. If you enjoy data, you’re in for a treat!
20% are non-residents.
55% applications are through the Common App, with Michigan and non-mid-West states being the largest populations of Common Apps.
Gains in first year student orientation registrations equal +221 since February 1. We’re fluctuating within 10 registrations compared to this time last year. As a reminder, NMU’s orientation fee of $126 is deferred until May 1 due to the national financial aid delay.
196 students have started their orientation registration but have not officially hit submit – our staff is following up with this group. 51 of these students have registered for housing.
Gains in housing deposits are significant compared to this time last year.
2023: 579 total housing applications, 434 submitted advanced payments = 75%.
2024: 743 total housing applications, 608 submitted advanced payments = 81%
+164 registrations over last year. As a reminder, students do pay the $50 application fee and if they choose, the $200 advanced payment when registering for housing, but it is fully refundable until May 1.
Roughly 80% of students who have registered for housing have also registered for orientation.
Transfer orientation registrations are up significantly – highest number of registrations at this point in time over the last 7 years. Possible post-Covid boost, deferred orientation deposits and our work in new markets are all reasons we’re considering for this increase.
Please reach out with questions, happy to help.
Kari
| Kari Garcia Pronouns: she/her Director of Admissions | Admissions Office Northern Michigan University Direct: 906-227-2221 | Admissions: 1-800-682-9797 1401 Presque Isle Ave, Marquette, MI 49855 nmu.edu/admissions kproehl@nmu.edu Northern Michigan University is located on the ancestral homelands of the Anishinaabe, Three Fires Confederacy, an honored alliance of the Ojibwe, Odawa, and Bodewadmik (Potowatomi) peoples. |
Fall 2024 Weekly Application Reports - February 8, 2024
Undergraduate Application Reports: February 8, 2024
Fall 2024
Hello, Everyone,
App reports delivered to your mailbox right before 5:00 p.m. 😊 It’s been an exciting week with a lot of great momentum.
Please feel free to share these with your NMU colleagues and reach out with any questions (x2221 or kproehl@nmu.edu).
You may view current and archived reports here: WeeklyEnrollment Reporting.
- These numbers include Global Campus students and international students.
- New this cycle: We will show application count totals in the narrative, and also break out the counts for campus-based (non-Global Campus) applications. This will help us track our progress on initiatives that are designed to impact the campus-based first-year and transfer populations.
Fall 2024 - Comparing February 8, 2023 to February 7, 2024
First-year/Freshman applications: 11,111 (+4902; +79% compared to the same point in time for Fall 2023)
Campus-based applications: 10,971; 98.7% of total. [Fall 2023: 98.3% of total at this point in time]
First-year/Freshman admissions: 9311 (+5112; +122%) compared to the same point in time for Fall 2023)
First-year/Freshman orientation registrations: 544(-20; -3.5%)
Transfer applications: 604 (+30; +5% compared to the same point in time for Fall 2023)
Campus-based applications: 525; 86.9% of total. [Fall 2023: 91.1% of total at this point in time]
Transfer admissions: 296 (+7; +2% compared to the same point in time for Fall 2023)
Transfer orientation registrations: 75 (+14; +23%)
Multi-year view:
| Fall 2017 2/8/17 | Fall 2018 2/14/18 | Fall 2019 2/13/19 | Fall 2020 2/12/20 | Fall 2021 2/10/21 | Fall 2022 2/9/22 | Fall 2023 2/8/23 | Fall 2024 2/7/24 | |
| Freshman Applications | 5497 | 7018 | 7054 | 5650 | 5836 | 5653 | 6209 | 11111 |
| Freshman Admits | 3903 | 4442 | 4414 | 3591 | 4001 | 3899 | 4199 | 9311 |
| % incomplete apps -F | 27% | 35% | 35% | 35% | 31% | 30% | 32% | 15% |
| Freshman Orientation Reg | 286 | 328 | 528 | 432 | 517 | 443 | 564 | 544 |
| % of admits reg for orientation | 7.3% | 7.4% | 12.0% | 12.0% | 12.9% | 11.4% | 13.4% | 5.8% |
| % of final fall reg for orientation | 19.1% | 20.3% | 33.0% | 31.9% | 34.7% | 31.5% | 36.5% | |
| Final Yield - % of admits enrolled | 33% | 32% | 32% | 32% | 32% | 32% | 32% | |
| New Freshman fall enrollment | 1501 | 1608 | 1601 | 1354 | 1491 | 1407 | 1542 | |
| Transfer Applications | 590 | 907 | 773 | 626 | 596 | 606 | 574 | 604 |
| Transfer Admits | 256 | 368 | 306 | 303 | 307 | 318 | 289 | 296 |
| % incomplete apps -T | 54% | 57% | 59% | 50% | 45% | 46% | 48% | 48% |
| Transfer Orientation Reg | 20 | 31 | 27 | 50 | 55 | 57 | 61 | 75 |
| % of admits reg for orientation | 7.8% | 8.4% | 8.8% | 16.5% | 17.9% | 17.9% | 21.1% | 25.3% |
| % of final fall reg for orientation | 4.9% | 6.4% | 6.4% | 12.7% | 15.3% | 14.8% | 13.8% | |
| Final Yield - % of admits enrolled | 61% | 61% | 60% | 56% | 54% | 55% | 56% | |
| Transfer fall enrollment | 407 | 488 | 419 | 393 | 360 | 386 | 440 | |
| Point-in-Cycle - New Freshmen | Fall 2017 | Fall 2018 | Fall 2019 | Fall 2020 | Fall 2021 | Fall 2022 | Fall 2023 | Fall 2024 |
| Final total fall freshman apps | 6345 | 7791 | 7837 | 6389 | 6693 | 6340 | 7063 | |
| % of total fall freshman apps received as of this date | 86.6% | 90.1% | 90.0% | 88.4% | 87.2% | 89.2% | 85.6% | |
| Final total fall freshman admits | 4591 | 5001 | 5035 | 4169 | 4670 | 4386 | 4848 | |
| % of total freshman fall admits received as of this date | 85.0% | 88.8% | 87.7% | 86.1% | 85.7% | 88.9% | 86.6% | |
| Point-in-Cycle - Transfers | Fall 2017 | Fall 2018 | Fall 2019 | Fall 2020 | Fall 2021 | Fall 2022 | Fall 2023 | Fall 2024 |
| Final total fall transfer apps | 1173 | 1574 | 1363 | 1229 | 1169 | 1216 | 1371 | |
| % of total fall transfer apps received as of this date | 50.3% | 57.6% | 56.7% | 50.9% | 51.0% | 49.8% | 41.8% | |
| Final total fall transfer admits | 668 | 801 | 702 | 701 | 672 | 700 | 787 | |
| % of total fall transfer admits received as of this date | 38.3% | 45.9% | 43.6% | 43.2% | 45.7% | 45.4% | 36.7% | |
| FAFSA switched to 10/1 in 2016 for those applying for fall 2017; College app/FAFSA access initiatives increased in MI in 2018-19 | First able to advertise and admit to MEDP in summer 2017 for fall 2017 | Full marketing & appl cycle for MEDP | First fall with test blind policy fully adopted | July 1, 2023 - Eliminated application fee; joined Common App for 2024 freshman apps. FAFSA delayed cycle, January – March |
A few things to note:
We experienced major gains in orientation registrations this week due to the deferral of the orientation fee to May 1, +169 over last week. Also, we've experienced gains in transfer student orientation, with registrations at this point in time -- higher than the last 5 years.
Another indicator we’re watching closely is housing registrations and deposits.
NMU’s Housing and Residence Life application opened on February 1, for students to apply for their residence hall room for the upcoming fall.
655 incoming students registered for housing
80% paid both the $50 application fee and the $200 advanced payment
Both fees are fully refundable until May 1.
It’s exciting to finally see some movement on both the orientation and housing metrics, and we’ll continue to watch both very closely over the coming months.
In the meantime, our future Wildcats are connecting! Here’s a fun quote from a parent who attended an event in Green Bay with her daughter. The event is part of a series hosted by both Admissions and Alumni.
“I just wanted to thank you again for the event that you organized in Green Bay. My daughter enjoyed her visit with the other girls, and instantly made new friends. She came to me and excitedly said, "Mom! I was going to email one of the girls that I met yesterday, but she messaged me first! We want to be roommates!!" We couldn't be happier that she has found someone to room with, and are excited for them to begin working on all of the fun details... Thanks for creating this relaxed opportunity for the kids to learn, meet, and connect with each other! We look forward to her future days at NMU!”
Please reach out with questions, happy to help.
Kari
Undergraduate Application Reports: February 1, 2024
Undergraduate Application Reports: February 1, 2024
Fall 2024
Hello, Everyone,
Here’s your weekly round of app reports. It’s been a busy few days and the numbers below are (as always) from a snapshot of the data that was taken the night before. However, a lot can change overnight – please see the notes section at the bottom of the report for some interesting updates and real time orientation registration and housing application numbers.
Please feel free to share these with your NMU colleagues and reach out with any questions (x2221 or kproehl@nmu.edu).
You may view current and archived reports here: WeeklyEnrollment Reporting.
- These numbers include Global Campus students and international students.
- New this cycle: We will show application count totals in the narrative, and also break out the counts for campus-based (non-Global Campus) applications. This will help us track our progress on initiatives that are designed to impact the campus-based first-year and transfer populations.
Fall 2024 - Comparing February 1, 2023 to January 31, 2024
First-year/Freshman applications: 10,926 (+4772; +78% compared to the same point in time for Fall 2023)
Campus-based applications: 10,790; 98.7% of total. [Fall 2023: 98.3% of total at this point in time]
First-year/Freshman admissions: 9102 (+4956; +120%) compared to the same point in time for Fall 2023)
First-year/Freshman orientation registrations: 375(-131; -25.9%)
As of the writing of this report – First-year/Freshman orientation registrations: 432(-74) a gain of +114 over last week.
Transfer applications: 573 (+19; +3% compared to the same point in time for Fall 2023)
Campus-based applications: 499; 87% of total. [Fall 2023: 90.9% of total at this point in time]
Transfer admissions: 271 (-1; -3% compared to the same point in time for Fall 2023)
Transfer orientation registrations: 55 (-4; -6.8%)
Multi-year view:
| Fall 2017 2/1/17 | Fall 2018 2/7/18 | Fall 2019 2/6/19 | Fall 2020 2/5/20 | Fall 2021 2/3/21 | Fall 2022 2/2/22 | Fall 2023 2/1/23 | Fall 2024 1/31/24 | |
| Freshman Applications | 5409 | 6937 | 6995 | 5560 | 5759 | 5581 | 6154 | 10926 |
| Freshman Admits | 3850 | 4358 | 4335 | 3529 | 3905 | 3801 | 4146 | 9102 |
| % incomplete apps -F | 27% | 35% | 36% | 35% | 32% | 31% | 32% | 15% |
| Freshman Orientation Reg | 286 | 296 | 483 | 385 | 496 | 406 | 506 | 375 |
| % of admits reg for orientation | 7.4% | 6.8% | 11.1% | 10.9% | 12.7% | 10.7% | 12.2% | 4.1% |
| % of final fall reg for orientation | 19.1% | 18.4% | 30.2% | 28.4% | 33.3% | 28.9% | 32% | |
| Final Yield - % of admits enrolled | 33% | 32% | 32% | 32% | 32% | 32% | 32% | |
| New Freshman fall enrollment | 1501 | 1608 | 1601 | 1354 | 1491 | 1407 | 1542 | |
| Transfer Applications | 562 | 879 | 750 | 601 | 573 | 583 | 554 | 573 |
| Transfer Admits | 242 | 353 | 285 | 284 | 287 | 289 | 274 | 271 |
| % incomplete apps -T | 55% | 57% | 61% | 51% | 47% | 49% | 48% | 50% |
| Transfer Orientation Reg | 20 | 26 | 22 | 44 | 68 | 52 | 59 | 55 |
| % of admits reg for orientation | 8.3% | 7.4% | 7.7% | 15.5% | 23.7% | 18.0% | 21.5% | 20.0% |
| % of final fall reg for orientation | 4.9% | 5.3% | 5.3% | 11.2% | 19.0% | 13.5% | 13.4% | |
| Final Yield - % of admits enrolled | 61% | 61% | 60% | 56% | 54% | 55% | 56% | |
| Transfer fall enrollment | 407 | 488 | 419 | 393 | 360 | 386 | 440 | |
| Point-in-Cycle - New Freshmen | Fall 2017 | Fall 2018 | Fall 2019 | Fall 2020 | Fall 2021 | Fall 2022 | Fall 2023 | Fall 2024 |
| Final total fall freshman apps | 6345 | 7791 | 7837 | 6389 | 6693 | 6340 | 7063 | |
| % of total fall freshman apps received as of this date | 85.2% | 89.0% | 89.3% | 87.0% | 86.0% | 88.0% | 87.1% | |
| Final total fall freshman admits | 4591 | 5001 | 5035 | 4169 | 4670 | 4386 | 4848 | |
| % of total freshman fall admits received as of this date | 78.0% | 87.1% | 86.1% | 84.6% | 83.6% | 86.7% | 85.5% | |
| Point-in-Cycle - Transfers | Fall 2017 | Fall 2018 | Fall 2019 | Fall 2020 | Fall 2021 | Fall 2022 | Fall 2023 | Fall 2024 |
| Final total fall transfer apps | 1173 | 1574 | 1363 | 1229 | 1169 | 1216 | 1371 | |
| % of total fall transfer apps received as of this date | 47.9% | 55.8% | 55.0% | 49.0% | 49.0% | 47.9% | 40.4% | |
| Final total fall transfer admits | 668 | 801 | 702 | 701 | 672 | 700 | 787 | |
| % of total fall transfer admits received as of this date | 36.2% | 44.1% | 40.6% | 40.5% | 42.7% | 41.3% | 34.8% | |
| FAFSA switched to 10/1 in 2016 for those applying for fall 2017; College app/FAFSA access initiatives increased in MI in 2018-19 | First able to advertise and admit to MEDP in summer 2017 for fall 2017 | Full marketing & appl cycle for MEDP | First fall with test blind policy fully adopted | July 1, 2023 - Eliminated application fee; joined Common App for 2024 freshman apps. FAFSA delayed cycle, January – March. |
A few things to note:
The Department of Education is estimating a mid-March delivery of financial aid FAFSA information to colleges and universities. That puts us about 4 months behind schedule in providing financial aid notices to prospective students. We are anticipating the first batch of financial aid notices to go out shortly after. In an effort to provide flexibility to families and keep their college planning process moving forward, NMU has made two significant changes to the housing and orientation registration refund/payment deferment policies that are only effective for Fall 2024.
Housing fees can be fully refundable up until May 1, 2024.
NMU’s Housing application opened at 7a.m this morning. All payments required for housing, including the $50 application and the $200 advanced payment will be fully refundable until May 1, 2024. This change provides opportunities for students to reserve their spot in line for room selection and participate in roommate matching as they wait for their financial aid notice to arrive.
No fee at time of orientation registration.
When student’s register for new student orientation at NMU, their orientation payment will be deferred (no payment at time of registration) until May 1, 2024. This means they can reserve their orientation date and still have flexibility when their financial aid notice arrives to choose whether to attend or not.
NMU is providing this assistance to help families take care of critical pieces in the enrollment process now, even though we recognize this change will most likely further cloud our indicators. Here’s a website that was shared with families yesterday, nmu.edu/admissions/updates.
Numbers at the time of this report:
Orientation: A total of 432 first year students have registered for orientation, a +114 gain over last week, with many registrations coming in last night after our announcement of the fee deferrals.
We also have 271 students who have started the orientation registration form at some point, but have not completed it and hit submit, many are in varying stages of form completion, but several are in this stage because they did not complete the payment portion of the form. Admissions counselors are reaching out to those students to let them know they can go back into the form and submit – and their payment will be deferred. We are anticipating additional movement from this as well.
Housing: A total of 381 new students have applied for a residence hall room and paid the $50 application fee, 315 of these students also paid the $200 advanced payment. The application opened at 7 a.m. today.
Please reach out with questions, happy to help.
Kari
| Kari Garcia Pronouns: she/her Director of Admissions | Admissions Office Northern Michigan University Direct: 906-227-2221 | Admissions: 1-800-682-9797 1401 Presque Isle Ave, Marquette, MI 49855 nmu.edu/admissions kproehl@nmu.edu Northern Michigan University is located on the ancestral homelands of the Anishinaabe, Three Fires Confederacy, an honored alliance of the Ojibwe, Odawa, and Bodewadmik (Potowatomi) peoples. |
Fall 2024 Weekly Application Reports - January 18, 2024
Undergraduate Application Reports: January 18, 2024
Fall 2024
Hello, Everyone,
Happy App Report Day! Or as everyone else likes to call it, Thursday. Enjoy.
Please feel free to share these with your NMU colleagues and reach out with any questions (x2221 or kproehl@nmu.edu).
You may view current and archived reports here: Weekly Enrollment Reporting.
- These numbers include Global Campus students and international students.
- New this cycle: We will show application count totals in the narrative, and also break out the counts for campus-based (non-Global Campus) applications. This will help us track our progress on initiatives that are designed to impact the campus-based first-year and transfer populations.
Fall 2024 - Comparing January 18, 2023 to January 17, 2024
First-year/Freshman applications: 10,585 (+4556; +76% compared to the same point in time for Fall 2023)
Campus-based applications: 10,454; 98.7% of total. [Fall 2023: 98.4% of total at this point in time]
First-year/Freshman admissions: 8785 (+4762; +118%) compared to the same point in time for Fall 2023)
First-year/Freshman orientation registrations: 279(-103; -27%)
Transfer applications: 515 (+17; +3% compared to the same point in time for Fall 2023)
Campus-based applications: 449; 87.1% of total. [Fall 2023: 90.7% of total at this point in time]
Transfer admissions: 234 (-4; -2% compared to the same point in time for Fall 2023)
Transfer orientation registrations: 37 (-8; -17.8%)
Multi-year view:
| Fall 2017 1/18/17 | Fall 2018 1/24/18 | Fall 2019 1/23/19 | Fall 2020 1/22/20 | Fall 2021 1/20/21 | Fall 2022 1/19/22 | Fall 2023 1/18/23 | Fall 2024 1/17/24 | |
| Freshman Applications | 5168 | 6691 | 6825 | 5388 | 5549 | 5393 | 6029 | 10585 |
| Freshman Admits | 3681 | 4152 | 4246 | 3383 | 3752 | 3678 | 4023 | 8785 |
| % incomplete apps -F | 27% | 36% | 35% | 36% | 32% | 31% | 33% | 16% |
| Freshman Orientation Reg | 192 | 224 | 355 | 301 | 353 | 294 | 382 | 279 |
| % of admits reg for orientation | 5.2% | 5.4% | 8.4% | 8.9% | 9.4% | 8.0% | 9.5% | 3.1% |
| % of final fall reg for orientation | 12.8% | 13.9% | 22.2% | 22.2% | 23.7% | 20.9% | 24.7% | |
| Final Yield - % of admits enrolled | 33% | 32% | 32% | 32% | 32% | 32% | 32.0% | |
| New Freshman fall enrollment | 1501 | 1608 | 1601 | 1354 | 1491 | 1407 | 1542 | |
| Transfer Applications | 479 | 801 | 678 | 537 | 529 | 517 | 498 | 515 |
| Transfer Admits | 199 | 283 | 236 | 244 | 251 | 243 | 238 | 234 |
| % incomplete apps -T | 57% | 62% | 64% | 53% | 50% | 52% | 50% | 52% |
| Transfer Orientation Reg | 12 | 18 | 15 | 30 | 36 | 37 | 45 | 37 |
| % of admits reg for orientation | 6.0% | 6.4% | 6.4% | 12.3% | 14.3% | 15.2% | 18.9% | 15.8% |
| % of final fall reg for orientation | 2.9% | 3.7% | 3.6% | 7.6% | 10.0% | 9.6% | 10.2% | |
| Final Yield - % of admits enrolled | 61% | 61% | 60% | 56% | 54% | 55% | 56% | |
| Transfer fall enrollment | 407 | 488 | 419 | 393 | 360 | 386 | 440 | |
| Point-in-Cycle - New Freshmen | Fall 2017 | Fall 2018 | Fall 2019 | Fall 2020 | Fall 2021 | Fall 2022 | Fall 2023 | Fall 2024 |
| Final total fall freshman apps | 6345 | 7791 | 7837 | 6389 | 6693 | 6340 | 7063 | |
| % of total fall freshman apps received as of this date | 81.4% | 85.9% | 87.1% | 84.3% | 82.9% | 85.1% | 85.2% | |
| Final total fall freshman admits | 4591 | 5001 | 5035 | 4169 | 4670 | 4386 | 4848 | |
| % of total freshman fall admits received as of this date | 80.2% | 83.0% | 84.3% | 81.1% | 80.3% | 83.9% | 82.8% | |
| Point-in-Cycle - Transfers | Fall 2017 | Fall 2018 | Fall 2019 | Fall 2020 | Fall 2021 | Fall 2022 | Fall 2023 | Fall 2024 |
| Final total fall transfer apps | 1173 | 1574 | 1363 | 1229 | 1169 | 1216 | 1371 | |
| % of total fall transferapps received as of this date | 40.8% | 50.9% | 49.7% | 43.7% | 45.3% | 42.5% | 36.3% | |
| Final total fall transfer admits | 668 | 801 | 702 | 701 | 672 | 700 | 787 | |
| % of total fall transferadmits received as of this date | 29.8% | 35.3% | 33.6% | 34.8% | 37.4% | 34.7% | 30.2% | |
| FAFSA switched to 10/1 in 2016 for those applying for fall 2017; College app/FAFSA access initiatives increased in MI in 2018-19 | First able to advertise and admit to MEDP in summer 2017 for fall 2017 | Full marketing & appl cycle for MEDP | First fall with test blind policy fully adopted | July 1, 2023 - Eliminated application fee; joined Common App for 2024 freshman apps |
We’ve been having an amazing admissions staff in-service this week with lots of conversations on how to keep students engaged and excited about NMU as everyone patiently waits for the delayed financial aid notices to arrive. Early March seems to be the target, which is on par with other schools around the state.
As always, this team brings lots of energy, lots of great ideas and is working hard to stay connected to prospective audiences.
Important Upcoming Dates:
Wildcat Weekend, March 15 – 16, 2024
Summer Counselor Visit Program: July 24-26, 2024
If you have questions, please let me know.
Thank you for all of your continued efforts.
Kari
Winter 2024 and Fall 2024 Weekly Application Reports - January 11, 2024
Undergraduate Application Reports: January 11, 2024
Winter 2024 and Fall 2024
Hello, Everyone,
Happy App Report Day! Or as everyone else likes to call it, Thursday. Enjoy.
Please feel free to share these with your NMU colleagues and reach out with any questions (x2221 or kproehl@nmu.edu).
You may view current and archived reports here: WeeklyEnrollment Reporting.
- These numbers include Global Campus students and international students.
- New this cycle: We will show application count totals in the narrative, and also break out the counts for campus-based (non-Global Campus) applications. This will help us track our progress on initiatives that are designed to impact the campus-based first-year and transfer populations.
Winter 2024 – Comparing January 11, 2023 to January 10, 2024
Winter 2023 new student enrollment included 50 first-year/freshmen and 109 transfer students.
First-year/Freshman applications: 415 (+110; +36% compared to last year at this time for Winter 2023)
Campus-based applications: 300; 72.2% of total. [Winter 2023: 75.7% of total at this point in time]
First-year/Freshman admissions: 124 (+32; +35% compared to last year at this time for Winter 2023)
First-year/Freshman orientation registrations: 55 (+3; +5.8%)
Transfer applications: 583 (+138; +31% compared to last year at this time for Winter 2023)
Campus-based applications: 299; 51.2% of total. [Winter 2023: 63.1% of total at this point in time]
Transfer admissions: 251 (+52; +26% compared to last year at this time for Winter 2023)
Transfer orientation registrations: 132 (+24; +22.2%)
Fall 2024 - Comparing January 11, 2023 to January 10, 2024
First-year/Freshman applications: 10,395 (+4462; +75% compared to the same point in time for Fall 2023)
Campus-based applications: 10,266; 98.7% of total. [Fall 2023: 98.4% of total at this point in time]
First-year/Freshman admissions: 8625 (+4684; +119%) compared to the same point in time for Fall 2023)
First-year/Freshman orientation registrations: 244(-82; -25.2%)
Transfer applications: 488 (+27; +6% compared to the same point in time for Fall 2023)
Campus-based applications: 427; 87.5% of total. [Fall 2023: 91.3% of total at this point in time]
Transfer admissions: 204 (+1; 0% compared to the same point in time for Fall 2023)
Transfer orientation registrations: 30 (-5; -14.3%)
Multi-year view:
| Fall 2017 1/11/17 | Fall 2018 1/17/18 | Fall 2019 1/16/19 | Fall 2020 1/15/20 | Fall 2021 1/13/21 | Fall 2022 1/12/22 | Fall 2023 1/11/23 | Fall 2024 1/10/24 | |
| Freshman Applications | 5053 | 6622 | 6739 | 5301 | 5449 | 5306 | 5933 | 10395 |
| Freshman Admits | 3593 | 4089 | 4151 | 3317 | 3668 | 3603 | 3941 | 8625 |
| % incomplete apps -F | 27% | 36% | 36% | 36% | 32% | 32% | 33% | 16% |
| Freshman Orientation Reg | 140 | 182 | 322 | 256 | 329 | 263 | 326 | 244 |
| % of admits reg for orientation | 3.9% | 4.5% | 7.8% | 7.7% | 9.0% | 7.3% | 8.3% | 2.8% |
| % of final fall reg for orientation | 9.3% | 11.3% | 20.1% | 18.9% | 22.1% | 18.7% | 21.4% | |
| Final Yield - % of admits enrolled | 33% | 32% | 32% | 32% | 32% | 32% | 32% | |
| New Freshman fall enrollment | 1501 | 1608 | 1601 | 1354 | 1491 | 1407 | 1542 | |
| Transfer Applications | 446 | 776 | 645 | 515 | 489 | 479 | 461 | 488 |
| Transfer Admits | 160 | 265 | 225 | 227 | 230 | 222 | 203 | 204 |
| % incomplete apps -T | 63% | 63% | 64% | 55% | 51% | 52% | 54% | 56% |
| Transfer Orientation Reg | 9 | 16 | 12 | 21 | 28 | 35 | 35 | 30 |
| % of admits reg for orientation | 5.6% | 6.0% | 5.3% | 9.3% | 12.2% | 15.8% | 17.2% | 14.7% |
| % of final fall reg for orientation | 2.2% | 3.3% | 2.9% | 5.3% | 7.8% | 9.1% | 7.9% | |
| Final Yield - % of admits enrolled | 61% | 61% | 60% | 56% | 54% | 55% | 56.0% | |
| Transfer fall enrollment | 407 | 488 | 419 | 393 | 360 | 386 | 440 | |
| Point-in-Cycle - New Freshmen | Fall 2017 | Fall 2018 | Fall 2019 | Fall 2020 | Fall 2021 | Fall 2022 | Fall 2023 | Fall 2024 |
| Final total fall freshmanapps | 6345 | 7791 | 7837 | 6389 | 6693 | 6340 | 7063 | |
| % of total fall freshman apps received as of this date | 79.6% | 85.0% | 86.0% | 83.0% | 81.4% | 83.7% | 84.0% | |
| Final total fall freshmanadmits | 4591 | 5001 | 5035 | 4169 | 4670 | 4386 | 4848 | |
| % of total freshman fall admits received as of this date | 78.3% | 81.8% | 82.4% | 79.6% | 78.5% | 82.1% | 81.2% | |
| Point-in-Cycle - Transfers | Fall 2017 | Fall 2018 | Fall 2019 | Fall 2020 | Fall 2021 | Fall 2022 | Fall 2023 | Fall 2024 |
| Final total fall transferapps | 1173 | 1574 | 1363 | 1229 | 1169 | 1216 | 1371 | |
| % of total fall transfer apps received as of this date | 38.0% | 49.3% | 47.3% | 41.9% | 41.8% | 39.4% | 33.5% | |
| Final total fall transferadmits | 668 | 801 | 702 | 701 | 672 | 700 | 787 | |
| % of total fall transfer admits received as of this date | 24.0% | 33.1% | 32.1% | 32.4% | 34.2% | 31.7% | 25.7% | |
| FAFSA switched to 10/1 in 2016 for those applying for fall 2017; College app/FAFSA access initiatives increased in MI in 2018-19 | First able to advertise and admit to MEDP in summer 2017 for fall 2017 | Full marketing & appl cycle for MEDP | First fall with test blind policy fully adopted | July 1, 2023 - Eliminated application fee; joined Common App for 2024 freshman apps |
Interesting Note:
As you may know, the delayed FAFSA cycle is delaying student decision behavior this year and financial aid notices will likely not be available for students until mid-March. Since Fall 2017, students have had the option to submit the FAFSA on October 1, which allowed us to provide financial aid notices in January. However, before 2017, the FAFSA form would open in January and we would provide financial aid notices in March.
So, I took a look at our % of admitted students who were registered for orientation at this time in 2015 and 2016, before the date change for the FAFSA.
Fall 2015 - % of admits registered for orientation was 3.0%.
Fall 2016 - % of admits registered for orientation was 4.7%
Fall 2024 - % of admits registered for orientation is 2.8%.
Granted, we have a much larger pool of admitted students this year, but I think it’s worth comparing because the timing on financial aid notices have a major impact on decision behavior.
As always, please let me know if you have any questions.
Kari
Winter 2024 and Fall 2024 Weekly Application Reports - January 4, 2024
Undergraduate Application Reports: January 4, 2024
Winter 2024 and Fall 2024
Hello, Everyone,
You may view current and archived reports here: WeeklyEnrollment Reporting.
- These numbers include Global Campus students and international students.
- New this cycle: We will show application count totals in the narrative, and also break out the counts for campus-based (non-Global Campus) applications. This will help us track our progress on initiatives that are designed to impact the campus-based first-year and transfer populations.
Winter 2024 – Comparing January 4, 2023 to January 3, 2024
Winter 2023 new student enrollment included 50 first-year/freshmen and 109 transfer students.
First-year/Freshman applications: 407 (+105; +35% compared to last year at this time for Winter 2023)
Campus-based applications: 297; 72.9% of total. [Winter 2023: 75.4% of total at this point in time]
First-year/Freshman admissions: 125 (+34; +37% compared to last year at this time for Winter 2023)
First-year/Freshman orientation registrations: 57 (+7; +14%)
Transfer applications: 572 (+133; +30% compared to last year at this time for Winter 2023)
Campus-based applications: 293; 51.2% of total. [Winter 2023: 66.7% of total at this point in time]
Transfer admissions: 238 (+38; +19% compared to last year at this time for Winter 2023)
Transfer orientation registrations: 117 (+19; +19.4%)
Fall 2024 - Comparing January 4, 2023 to January 3, 2024
First-year/Freshman applications: 10,164 (+4389; +76% compared to the same point in time for Fall 2023)
Campus-based applications: 10,040; 98.7% of total. [Fall 2023: 98.4% of total at this point in time]
First-year/Freshman admissions: 8427 (+4585; +119%) compared to the same point in time for Fall 2023)
First-year/Freshman orientation registrations: 213 (-48; -18.4%)
Transfer applications: 445 (+34; +8% compared to the same point in time for Fall 2023)
Campus-based applications: 391; 87.8% of total. [Fall 2023: 90.9% of total at this point in time]
Transfer admissions: 185 (+4; +2% compared to the same point in time for Fall 2023)
Transfer orientation registrations: 23 (-5; -17.9%)
Multi-year view:
| Fall 2017 1/4/17 | Fall 2018 1/3/18 | Fall 2019 1/2/19 | Fall 2020 1/8/20 | Fall 2021 1/6/21 | Fall 2022 1/5/22 | Fall 2023 1/4/23 | Fall 2024 1/3/24 | |
| Freshman Applications | 4905 | 6252 | 6380 | 5197 | 5268 | 5213 | 5775 | 10164 |
| Freshman Admits | 3456 | 3926 | 3928 | 3231 | 3545 | 3504 | 3842 | 8427 |
| % incomplete apps -F | 28% | 35% | 36% | 37% | 32% | 32% | 33% | 16% |
| Freshman Orientation Reg | 92 | 122 | 228 | 218 | 304 | 231 | 261 | 213 |
| % of admits reg for orientation | 2.7% | 3.1% | 5.8% | 6.7% | 8.6% | 6.6% | 6.8% | 2.5% |
| % of final fall reg for orientation | 6.1% | 7.6% | 14.2% | 16.1% | 20.4% | 12.4% | 16.9% | |
| Final Yield - % of admits enrolled | 33% | 32% | 32% | 32% | 32% | 32% | 32% | |
| New Freshman fall enrollment | 1501 | 1608 | 1601 | 1354 | 1491 | 1407 | 1542 | |
| Transfer Applications | 401 | 628 | 537 | 477 | 414 | 444 | 411 | 445 |
| Transfer Admits | 133 | 209 | 177 | 197 | 198 | 195 | 181 | 185 |
| % incomplete apps -T | 66% | 64% | 66% | 57% | 50% | 55% | 54% | 56% |
| Transfer Orientation Reg | 5 | 11 | 6 | 17 | 22 | 29 | 28 | 23 |
| % of admits reg for orientation | 3.8% | 5.3% | 3.4% | 8.6% | 11.1% | 14.9% | 15.5% | 12.4% |
| % of final fall reg for orientation | 1.2% | 2.3% | 1.4% | 4.3% | 6.1% | 7.5% | 6.3% | |
| Final Yield - % of admits enrolled | 61% | 61% | 60% | 56% | 54% | 55% | 56% | |
| Transfer fall enrollment | 407 | 488 | 419 | 393 | 360 | 386 | 440 | |
| Point-in-Cycle - New Freshmen | Fall 2017 | Fall 2018 | Fall 2019 | Fall 2020 | Fall 2021 | Fall 2022 | Fall 2023 | Fall 2024 |
| Final total fall freshman apps | 6345 | 7791 | 7837 | 6389 | 6693 | 6340 | 7063 | |
| % of total fall freshman apps received as of this date | 77.3% | 80.2% | 81.4% | 81.3% | 78.7% | 82.2% | 81.1% | |
| Final total fall freshman admits | 4591 | 5001 | 5035 | 4169 | 4670 | 4386 | 4848 | |
| % of total freshman fall admits received as of this date | 75.3% | 78.5% | 78.0% | 77.5% | 75.9% | 80.0% | 79.2% | |
| Point-in-Cycle - Transfers | Fall 2017 | Fall 2018 | Fall 2019 | Fall 2020 | Fall 2021 | Fall 2022 | Fall 2023 | Fall 2024 |
| Final total fall transfer apps | 1173 | 1574 | 1363 | 1229 | 1169 | 1216 | 1371 | |
| % of total fall transfer apps received as of this date | 34.2% | 40.0% | 39.4% | 38.8% | 35.4% | 36.5% | 29.8% | |
| Final total fall transfer admits | 668 | 801 | 702 | 701 | 672 | 700 | 787 | |
| % of total fall transfer admits received as of this date | 19.9% | 26.1% | 25.2% | 28.1% | 29.5% | 27.9% | 22.9% | |
| FAFSA switched to 10/1 in 2016 for those applying for fall 2017; College app/FAFSA access initiatives increased in MI in 2018-19 | First able to advertise and admit to MEDP in summer 2017 for fall 2017 | Full marketing & appl cycle for MEDP | First fall with test blind policy fully adopted | July 1, 2023 - Eliminated application fee; joined Common App for 2024 freshman apps. |
A few things to note:
As you can see from the numbers above, several factors are making our crystal ball very cloudy this cycle. The Common App (which resulted in increased applications), the removal of the application fee (which resulted in more completed applications) and the delayed FAFSA. We are watching all of these factors very closely. Although, first year applications and admits for Fall 2024 have increased substantially – a delayed financial aid cycle due to the late rollout of the FAFSA, may produce a lag in orientation registrations as we move through the next few months. It’s still way too early in the cycle to use orientation registrations as a solid indicator, but we’re keeping an eye on it as we ramp up our yield activities.
Stay Tuned, it’s going to be an interesting few months ahead.
Presidential Scholars Competition Update –
-16 Harden Scholarships (tuition, most required fees, room and board) were awarded to 15 first year students and 1 transfer student. The Harden winners are also welcomed to the Honors Program.
-60 Waldo Scholarships ($3,000/yr.)
-140 Kaye-Munson Scholarships ($1,000/yr)
-10 Leadership Scholarships ($2,000/yr.) are awarded by the Center for Student Enrichment. These will be awarded in 2024.
-Those not receiving one of the scholarships noted above will receive a $500 award for the 2024-25 academic year.
All competitors have been notified.
We very much appreciate all in the NMU community who made this competition successful:
· 53 NMU students assisted with small group facilitation (Graduate Assistant Mandy Bonesteel and her team at CSE worked VERY hard to get student volunteers).
· 9 staff members (outside of our Admissions staff) assisted with small group facilitation.
· 16 NMU alumni also helped facilitate small groups
· 9 staff participated in the Panel of Experts for parents/supporters in over the two competitions
· 116 faculty/staff conducted interviews (one of them being a former staff member/retiree!).
Thank-you, All!
Kari
Winter 2024 and Fall 2024 Weekly Application Reports - December 21, 2023
Undergraduate Application Reports: December 21, 2023
Winter 2024 and Fall 2024
Link to Reports for Winter 2024 and Fall 2024
- These numbers include Global Campus students and international students.
- New this cycle: We will show application count totals in the narrative, and also break out the counts for campus-based (non-Global Campus) applications. This will help us track our progress on initiatives that are designed to impact the campus-based first-year and transfer populations.
Winter 2024 – Comparing December 21, 2022 to December 20, 2023
Winter 2023 new student enrollment included 50 first-year/freshmen and 109 transfer students.
First-year/Freshman applications: 398 (+102; +34% compared to last year at this time for Winter 2023)
Campus-based applications: 293; 73.6% of total. [Winter 2023: 76.4% of total at this point in time]
First-year/Freshman admissions: 125 (+34; +37% compared to last year at this time for Winter 2023)
First-year/Freshman orientation registrations: 52 (+5; +10.6%)
Transfer applications: 556 (+131; +31% compared to last year at this time for Winter 2023)
Campus-based applications: 285; 51.3% of total. [Winter 2023: 63.8% of total at this point in time]
Transfer admissions: 230 (+40; +21% compared to last year at this time for Winter 2023)
Transfer orientation registrations: 109 (+22; +25.3%)
Fall 2024 - Comparing December 14, 2022 to December 13, 2023
First-year/Freshman applications: 9956 (+4226; +74% compared to the same point in time for Fall 2023)
Campus-based applications: 9838; 98.8% of total. [Fall 2023: 98.4% of total at this point in time]
First-year/Freshman admissions: 8312 (+4493; +118%) compared to the same point in time for Fall 2023)
First-year/Freshman orientation registrations: 187 (-19; -9.2%)
Transfer applications: 414 (+20; +5% compared to the same point in time for Fall 2023)
Campus-based applications: 363; 87.7% of total. [Fall 2023: 91.4% of total at this point in time]
Transfer admissions: 161 (-9; -5% compared to the same point in time for Fall 2023)
Transfer orientation registrations: 18 (-5)
Multi-year view:
| Fall 2017 12/21/16 | Fall 2018 12/20/17 | Fall 2019 12/19/18 | Fall 2020 12/18/19 | Fall 2021 12/16/20 | Fall 2022 12/14/21 | Fall 2023 12/21/22 | Fall 2024 12/21/23 | |
| Freshman Applications | 4865 | 6216 | 6337 | 4990 | 5129 | 5062 | 5730 | 9956 |
| Freshman Admits | 3399 | 3836 | 3849 | 3084 | 3413 | 3437 | 3819 | 8312 |
| % incomplete apps -F | 28% | 37% | 37% | 37% | 33% | 32% | 33% | 16% |
| Freshman Orientation Reg | 67 | 81 | 168 | 141 | 198 | 174 | 206 | 187 |
| % of admits reg for orientation | 2.0% | 2.1% | 4.4% | 4.6% | 5.8% | 5.1% | 5.2% | 2.2% |
| % of final fall reg for orientation | 4.5% | 5.0% | 10.5% | 10.4% | 13.3% | 12.4% | 13.4% | |
| Final Yield - % of admits enrolled | 33% | 32% | 32% | 32% | 32% | 32% | 32% | |
| New Freshman fall enrollment | 1501 | 1608 | 1601 | 1354 | 1491 | 1407 | 1542 | |
| Transfer Applications | 386 | 611 | 520 | 416 | 370 | 392 | 394 | 414 |
| Transfer Admits | 124 | 174 | 157 | 154 | 168 | 168 | 170 | 161 |
| % incomplete apps -T | 67% | 69% | 69% | 62% | 53% | 56% | 55% | 59% |
| Transfer Orientation Reg | 5 | 6 | 5 | 10 | 19 | 23 | 23 | 18 |
| % of admits reg for orientation | 4.0% | 3.4% | 3.2% | 6.5% | 11.3% | 13.7% | 13.5% | 11.2% |
| % of final fall reg for orientation | 1.2% | 1.2% | 1.2% | 2.5% | 5.3% | 6.0% | 5.2% | |
| Final Yield - % of admits enrolled | 61% | 61% | 60% | 56% | 54% | 55% | 56% | |
| Transfer fall enrollment | 407 | 488 | 419 | 393 | 360 | 386 | 440 | |
| Point-in-Cycle - New Freshmen | Fall 2017 | Fall 2018 | Fall 2019 | Fall 2020 | Fall 2021 | Fall 2022 | Fall 2023 | Fall 2024 |
| Final total fall freshman apps | 6345 | 7791 | 7837 | 6389 | 6693 | 6340 | 7063 | |
| % of total fall freshman apps received as of this date | 76.7% | 79.8% | 80.9% | 78.1% | 76.6% | 79.8% | 81.1% | |
| Final total fall freshman admits | 4591 | 5001 | 5035 | 4169 | 4670 | 4386 | 4848 | |
| % of total freshman fall admits received as of this date | 74.0% | 76.7% | 76.4% | 74.0% | 73.1% | 78.4% | 78.8% | |
| Point-in-Cycle - Transfers | Fall 2017 | Fall 2018 | Fall 2019 | Fall 2020 | Fall 2021 | Fall 2022 | Fall 2023 | Fall 2024 |
| Final total fall transfer apps | 1173 | 1574 | 1363 | 1229 | 1169 | 1216 | 1371 | |
| % of total fall transferapps received as of this date | 32.9% | 38.8% | 38.2% | 33.8% | 31.7% | 32.2% | 28.7% | |
| Final total fall transfer admits | 668 | 801 | 702 | 701 | 672 | 700 | 787 | |
| % of total fall transferadmits received as of this date | 18.6% | 21.7% | 22.4% | 22.0% | 25.0% | 24.0% | 21.6% | |
| FAFSA switched to 10/1 in 2016 for those applying for fall 2017; College app/FAFSA access initiatives increased in MI in 2018-19 | First able to advertise and admit to MEDP in summer 2017 for fall 2017 | Full marketing & appl cycle for MEDP | First fall with test blind policy fully adopted | July 1, 2023 - Eliminated application fee; joined Common App for 2024 freshman apps. |
Historically, we could expect 80% of our fall freshman applications and 30% of our transfer fall applications received by the end of December. The Common App will change this benchmark.
Perspective:
The Fall 2023 TOTAL freshman application count = 7064.
For Fall 2024, as of last night, freshman applications processed = 9956.
- 56.6% of our processed fall freshman applications are via the Common App.
- Applications and documents are being processed within 1 day of receipt.
- After the break, college transcripts and winter applications will receive priority processing.
You may have noticed that the fall 2024 orientation registrations for first year/new freshmen have been lagging slightly behind last year. Two points here:
1. It’s way too early to base any predications on orientation registrations, not just this year, but for any fall cycle.
2. The orientation row below shows orientation registrations at this point in time for multiple years, so that provides some perspective.
| Fall 2017 12/21/16 | Fall 2018 12/20/17 | Fall 2019 12/19/18 | Fall 2020 12/18/19 | Fall 2021 12/16/20 | Fall 2022 12/14/21 | Fall 2023 12/21/22 | Fall 2024 12/21/23 | |
| Freshman Applications | 4865 | 6216 | 6337 | 4990 | 5129 | 5062 | 5730 | 9956 |
| Freshman Admits | 3399 | 3836 | 3849 | 3084 | 3413 | 3437 | 3819 | 8312 |
| Freshman Orientation Reg | 67 | 81 | 168 | 141 | 198 | 174 | 206 | 187 |
| % of admits reg for orientation | 2.0% | 2.1% | 4.4% | 4.6% | 5.8% | 5.1% | 5.2% | 2.2% |
Presidential Scholars Competition Update – All competitors have been notified about the scholarships they will receive as a result of the competition. In early January, Kari will include information about the numbers of various scholarships awarded and some other competition stats. All interviewers will receive a list of the winners and an invitation to let Kari or Kate know if they would like to send a note to the student(s) they interviewed.
Thank-you, again, to everyone across campus who supported this important event.
One final note…. I hope these weekly application reports and narratives have been helpful in providing context and information that supports your work at NMU. I appreciate everyone who has helped create the 35 standard weekly reports that feed into this communication, as well as those who have assisted with ad hoc reports and those who have built and supported systems that allow users like me to create reports on the fly to aid in understanding what’s happening at any given time. I especially appreciate the readers and the questioners and the suggesters.
Thank-you for the encouragement, support, and words of wisdom you have shared with me over the years, and for your enthusiasm for working together to achieve goals. Happy holidays! May your 2024 be filled with everything that brings you joy.
Gerri
Winter 2024 and Fall 2024 Weekly Application Reports - December 14, 2023
Undergraduate Application Reports: December 14, 2023
Winter 2024 and Fall 2024
Link to Reports for Winter 2024 and Fall 2024
- These numbers include Global Campus students and international students.
New this cycle: We will show application count totals in the narrative, and also break out the counts for campus-based (non-Global Campus) applications. This will help us track our progress on initiatives that are designed to impact the campus-based first-year and transfer populations.
Winter 2024 – Comparing December 14, 2022 to December 13, 2023
Winter 2023 new student enrollment included 50 first-year/freshmen and 109 transfer students.
First-year/Freshman applications: 393 (+103; +36% compared to last year at this time for Winter 2023)
Campus-based applications: 291; 74.0% of total. [Winter 2023: 76.9% of total at this point in time]
First-year/Freshman admissions: 119 (+32; +37% compared to last year at this time for Winter 2023)
First-year/Freshman orientation registrations: 50 (+11; +28.2%)
Transfer applications: 523 (+111; +27% compared to last year at this time for Winter 2023)
Campus-based applications: 269; 51.4% of total. [Winter 2023: 64.3% of total at this point in time]
Transfer admissions: 220 (+35; +19% compared to last year at this time for Winter 2023)
Transfer orientation registrations: 106 (+24; +29.3%)
Fall 2024 - Comparing December 14, 2022 to December 13, 2023
First-year/Freshman applications: 9729 (+4086; +72% compared to the same point in time for Fall 2023)
Campus-based applications: 9610; 98.8% of total. [Fall 2023: 98.4% of total at this point in time]
First-year/Freshman admissions: 8061 (+4334; +116%) compared to the same point in time for Fall 2023)
First-year/Freshman orientation registrations: 167 (-17; -9.2%)
Transfer applications: 401 (+34; +9% compared to the same point in time for Fall 2023)
Campus-based applications: 355; 88.5% of total. [Fall 2023: 91.8% of total at this point in time]
Transfer admissions: 154 (-7; -4% compared to the same point in time for Fall 2023)
Transfer orientation registrations: 16 (-5)
Multi-year view:
| Fall 2017 12/14/16 | Fall 2018 12/13/17 | Fall 2019 12/12/18 | Fall 2020 12/11/19 | Fall 2021 12/16/20 | Fall 2022 12/15/21 | Fall 2023 12/14/22 | Fall 2024 12/13/23 | |
| Freshman Applications | 4787 | 6089 | 6183 | 4880 | 5129 | 4955 | 5643 | 9729 |
| Freshman Admits | 3289 | 3711 | 3731 | 2973 | 3413 | 3349 | 3727 | 8061 |
| % incomplete apps -F | 30% | 37% | 38% | 38% | 33% | 32% | 33% | 17% |
| Freshman Orientation Reg | 52 | 71 | 149 | 126 | 198 | 160 | 184 | 167 |
| % of admits reg for orientation | 1.6% | 1.9% | 4.0% | 4.2% | 5.8% | 4.8% | 4.9% | 2.1% |
| % of final fall reg for orientation | 3.5% | 4.4% | 9.3% | 9.3% | 13.3% | 11.4% | 11.9% | |
| Final Yield - % of admits enrolled | 33% | 32% | 32% | 32% | 32% | 32% | 32% | |
| New Freshman fall enrollment | 1501 | 1608 | 1601 | 1354 | 1491 | 1407 | 1542 | |
| Transfer Applications | 367 | 577 | 494 | 397 | 370 | 374 | 367 | 401 |
| Transfer Admits | 121 | 160 | 149 | 142 | 168 | 152 | 161 | 154 |
| % incomplete apps -T | 66% | 70% | 69% | 63% | 53% | 59% | 54% | 60% |
| Transfer Orientation Reg | 3 | 6 | 4 | 9 | 19 | 18 | 21 | 16 |
| % of admits reg for orientation | 2.5% | 3.8% | 2.7% | 6.3% | 11.3% | 11.8% | 13.0% | 10.4% |
| % of final fall reg for orientation | 0.7% | 1.2% | 1.0% | 2.3% | 5.3% | 4.7% | 4.8% | |
| Final Yield - % of admits enrolled | 61% | 61% | 60% | 56% | 54% | 55% | 56% | |
| Transfer fall enrollment | 407 | 488 | 419 | 393 | 360 | 386 | 440 | |
| Point-in-Cycle - New Freshmen | Fall 2017 | Fall 2018 | Fall 2019 | Fall 2020 | Fall 2021 | Fall 2022 | Fall 2023 | Fall 2024 |
| Final total fall freshman apps | 6345 | 7791 | 7837 | 6389 | 6693 | 6340 | 7063 | |
| % of total fall freshman apps received as of this date | 75.4% | 78.2% | 78.9% | 76.4% | 76.6% | 78.2% | 79.9% | |
| Final total fall freshman admits | 4591 | 5001 | 5035 | 4169 | 4670 | 4386 | 4848 | |
| % of total freshman fall admits received as of this date | 71.6% | 74.2% | 74.1% | 71.3% | 73.1% | 76.4% | 76.9 | |
| Point-in-Cycle - Transfers | Fall 2017 | Fall 2018 | Fall 2019 | Fall 2020 | Fall 2021 | Fall 2022 | Fall 2023 | Fall 2024 |
| Final total fall transfer apps | 1173 | 1574 | 1363 | 1229 | 1169 | 1216 | 1371 | |
| % of total fall transferapps received as of this date | 31.3% | 36.7% | 36.2% | 32.3% | 31.7% | 30.8% | 26.8% | |
| Final total fall transfer admits | 668 | 801 | 702 | 701 | 672 | 700 | 787 | |
| % of total fall transferadmits received as of this date | 18.1% | 20.0% | 21.2% | 20.3% | 25.0% | 21.7% | 20.5% | |
| FAFSA switched to 10/1 in 2016 for those applying for fall 2017; College app/FAFSA access initiatives increased in MI in 2018-19 | First able to advertise and admit to MEDP in summer 2017 for fall 2017 | Full marketing & appl cycle for MEDP | First fall with test blind policy fully adopted | July 1, 2023 - Eliminated application fee; joined Common App for 2024 apps. |
Historically, we could expect 80% of our fall freshman applications and 30% of our transfer fall applications received by the end of December. The Common App will change this benchmark.
PERSPECTIVE:
The Fall 2023 TOTAL freshman application count = 7064.
For Fall 2024, as of last night, freshman applications processed = 9729.
- 56.5% of our processed fall freshman applications are via the Common App.
The processing staff – Amber, Keri and Nicole - are working on applications submitted yesterday – so ALL CAUGHT UP! YAY TEAM!
Choosing a college – factors and timeline impacting the final decision
Students intending to be first-time college students in the fall follow a general timeline.
Fall: Apply to colleges and for financial aid.
Winter: Review admission and financial aid offers.
Spring: Visit or re-visit top choices, pick THE one, and deposit.
Program offerings, experiential opportunities, the look and feel of the place, and how they are treated all factor into the decision. And the bottom line – can our family afford my top choice? With the changes and delay in the Federal financial aid process this year, most colleges will provide aid offers several months later than usual. This will likely impact decision-making for fall 2024.
But, many activities have contributed to getting students interested in NMU. Here are a few…
- Over 1100 off-campus outreach activities have been conducted since August 1, 2023 – primarily college fairs, and visits to high schools and community colleges.
- Over 1200 prospective students have visited through the Campus Visit Program since July 1, 2023.
- Wildcat Weekend and Presidential Scholars brought over 700 students to campus.
- A variety of department-based programs and events also hosted prospective students both on and off campus this semester.
All of this, and everyone working so hard to help prospective students and families discover if NMU is their school, moves us in a positive direction. Thank-you!
Please let me know if you have questions about the reports or any of the comments above.
Gerri
Winter 2024 and Fall 2024 Weekly Application Reports - December 6, 2023
Undergraduate Application Reports: December 6, 2023
Winter 2024 and Fall 2024
Link to Reports for Winter 2024 and Fall 2024
- These numbers include Global Campus students and international students.
- New this cycle: We will show application count totals in the narrative, and also break out the counts for campus-based (non-Global Campus) applications. This will help us track our progress on initiatives that are designed to impact the campus-based first-year and transfer populations.
- Orientation registration reports for Winter and Fall are included.
Winter 2024 – Comparing December 7, 2022 to December 6, 2023
Winter 2023 new student enrollment included 50 first-year/freshmen and 109 transfer students.
First-year/Freshman applications: 377 (+93; +33% compared to last year at this time for Winter 2023)
Campus-based applications: 281; 74.5% of total. [Winter 2023: 77.4% of total at this point in time]
First-year/Freshman admissions: 117 (+31; +36% compared to last year at this time for Winter 2023)
First-year/Freshman orientation registrations: 46 (+12)
Transfer applications: 505 (+108; +27% compared to last year at this time for Winter 2023)
Campus-based applications: 261; 51.6% of total. [Winter 2023: 64.9% of total at this point in time]
Transfer admissions: 217 (+42; +24% compared to last year at this time for Winter 2023)
Transfer orientation registrations: 98 (+26)
Fall 2024 - Comparing December 7, 2022 to December 6, 2023
As a reminder: Historically, we could expect 80% of our fall freshman applications and 30% of our transfer fall applications received by the end of December. The Common App will change this benchmark. As of today, 56.6% of our processed fall freshman applications are via the Common App.
First-year/Freshman applications: 9511 (+3957; +71% compared to the same point in time for Fall 2023)
Campus-based applications: 9399; 97.9% of total. [Fall 2023: 98.3% of total at this point in time]
First-year/Freshman admissions: 7817 (+4194; +116%) compared to the same point in time for Fall 2023)
First-year/Freshman orientation registrations: 149 (-17; -10.2%)
Transfer applications: 378 (+18; +5% compared to the same point in time for Fall 2023)
Campus-based applications: 335; 88.6% of total. [Fall 2023: 92.2% of total at this point in time]
Transfer admissions: 144 (-7; -5% compared to the same point in time for Fall 2023)
Transfer orientation registrations: 15 (-1)
Multi-year view:
| Fall 2017 12/7/16 | Fall 2018 12/6/17 | Fall 2019 12/5/18 | Fall 2020 12/4/19 | Fall 2021 12/9/20 | Fall 2022 12/8/21 | Fall 2023 12/7/22 | Fall 2024 12/6/23 | |
| Freshman Applications | 4669 | 5931 | 6038 | 4787 | 5007 | 4832 | 5554 | 9511 |
| Freshman Admits | 3082 | 3559 | 3561 | 2818 | 3277 | 3250 | 3623 | 7817 |
| % incomplete apps -F | 32% | 38% | 39% | 39% | 34% | 32% | 34% | 17% |
| Freshman Orientation Reg | 46 | 64 | 133 | 110 | 160 | 146 | 166 | 149 |
| % of admits reg for orientation | 1.5% | 1.8% | 3.7% | 3.9% | 4.9% | 4.5% | 4.9% | 1.9% |
| % of final fall reg for orientation | 3.1% | 4.0% | 8.3% | 8.1% | 10.7% | 10.4% | 10.8% | |
| Final Yield - % of admits enrolled | 33% | 32% | 32% | 32% | 32% | 32% | 32% | |
| New Freshman fall enrollment | 1501 | 1608 | 1601 | 1354 | 1491 | 1407 | 1542 | |
| Transfer Applications | 343 | 557 | 474 | 377 | 355 | 356 | 360 | 378 |
| Transfer Admits | 109 | 148 | 124 | 131 | 158 | 138 | 151 | 144 |
| % incomplete apps -T | 67% | 71% | 73% | 64% | 54% | 60% | 56% | 60% |
| Transfer Orientation Reg | 2 | 4 | 4 | 8 | 18 | 16 | 16 | 15 |
| % of admits reg for orientation | 1.8% | 2.7% | 3.2% | 6.1% | 11.4% | 11.6% | 10.6% | 10.4% |
| % of final fall reg for orientation | 0.5% | 0.8% | 1.0% | 2.0% | 5.0% | 4.1% | 3.6% | |
| Final Yield - % of admits enrolled | 61% | 61% | 60% | 56% | 54% | 55% | 56% | |
| Transfer fall enrollment | 407 | 488 | 419 | 393 | 360 | 386 | 440 | |
| Point-in-Cycle - New Freshmen | Fall 2017 | Fall 2018 | Fall 2019 | Fall 2020 | Fall 2021 | Fall 2022 | Fall 2023 | Fall 2024 |
| Final total fall freshman apps | 6345 | 7791 | 7837 | 6389 | 6693 | 6340 | 7063 | |
| % of total fall freshman apps received as of this date | 73.6% | 76.1% | 77.0% | 74.9% | 74.8% | 76.2% | 78.6% | |
| Final total fall freshman admits | 4591 | 5001 | 5035 | 4169 | 4670 | 4386 | 4848 | |
| % of total freshman fall admits received as of this date | 67.1% | 71.2% | 70.7% | 67.6% | 70.2% | 74.1% | 74.7 | |
| Point-in-Cycle - Transfers | Fall 2017 | Fall 2018 | Fall 2019 | Fall 2020 | Fall 2021 | Fall 2022 | Fall 2023 | Fall 2024 |
| Final total fall transfer apps | 1173 | 1574 | 1363 | 1229 | 1169 | 1216 | 1371 | |
| % of total fall transferapps received as of this date | 29.2% | 35.4% | 34.8% | 30.7% | 30.4% | 29.3% | 26.3 | |
| Final total fall transfer admits | 668 | 801 | 702 | 701 | 672 | 700 | 787 | |
| % of total fall transferadmits received as of this date | 16.3% | 18.5% | 17.7% | 18.7% | 23.5% | 19.7% | 19.2% | |
| FAFSA switched to 10/1 in 2016 for those applying for fall 2017; College app/FAFSA access initiatives increased in MI in 2018-19 | First able to advertise and admit to MEDP in summer 2017 for fall 2017 | Full marketing & appl cycle for MEDP | First fall with test blind policy fully adopted; Orientation registration opened in mid-November. | July 1, 2023 - Eliminated application fee; joined Common App for 2024 apps. |
Common App Q&A
Q: Do transfer students use the Common App to apply to NMU?
A: No. NMU is accepting the Common App from first-year/new freshmen (domestic, campus-based) for Winter 2024 and Fall 2024. (The Common App opens terms each August for the following year.)
Q. Is the volume of applications unique to NMU?
A. No. See below.
Early Common App Data Show Sharp Increase In College Applications
Inside Higher Ed (11/16, Knox) reports preliminary data from the Common App – “which counts about one-third of America’s four-year undergraduate institutions as members – show a sharp increase in applications submitted before Nov. 1, a jump of 41 percent over the 2019-20 application cycle.” Applications from minority students “increased 67 percent,” while applications from students “at high schools in lower-income ZIP codes also rose more than the general rate: 52 percent since 2019-20, versus 32 percent from wealthier ZIP codes.” The number of individual students using the Common App “increased 12 percent year over year, and those from underrepresented racial and ethnic groups rose by 21 percent.” However, one college leader “cautioned that it may reflect the growing popularity of early action and early decision – and increased pressure on students to apply to a longer list of colleges – rather than portend a comparable spike in enrollments next year.”
Additional Context for Fall 2024 – Changes in the financial aid cycle
Last year at this time, NMU had received FAFSA information from 1,702 fall 2023 admitted students (see chart below) and by December 20, 2022, the Financial Aid team sent financial aid offers to 1,788 students. For Fall 2024 admits, it is predicted that universities will not receive FAFSA information until late January. The later timeline for admitted students to receive financial aid offers (from all schools) is very likely to impact decision timelines and the indicators such as orientation registration. More information about the FAFSA changes can be found here.
Please let me know if you have questions about the reports or any of the comments above.
Kari Garcia
Sending on Gerri’s behalf while she’s out of the office.
Winter 2024 and Fall 2024 Weekly Application Reports - November 30, 2023
Undergraduate Application Reports: November 30, 2023
Link to Reports for Winter 2024 and Fall 2024
- These numbers include Global Campus students and international students.
- Orientation registration reports for Winter and Fall are included.
- Comparing November 30, 2022 to November 29, 2023
Winter 2024
(Note: Winter 2023 new student enrollment included 50 first-year/freshmen and 109 transfer students.)
First-year/Freshman applications: 366 (+82; +29% compared to last year at this time for Winter 2023)
Campus-based applications: 274; 74.9% of total. [Winter 2023: 77.8% of total at this point in time]
First-year/Freshman admissions: 109 (+26; +31% compared to last year at this time for Winter 2023)
First-year/Freshman orientation registrations: 41 (+8)
Transfer applications: 488 (+105; +27% compared to last year at this time for Winter 2023)
Campus-based applications: 254; 52% of total. [Winter 2023: 64.5% of total at this point in time]
Transfer admissions: 209 (+39; +23% compared to last year at this time for Winter 2023)
Transfer orientation registrations: 84 (+18)
Fall 2024
Point in cycle: Admissions outreach and communication have been focused on application generation and completion and encouraging visits to campus. Over 1100 off-campus outreach activities have been conducted since August 1, 2023 – primarily college fairs, and visits to high schools and community colleges.
Historically, we could expect 80% of our fall freshman applications and 30% of our transfer fall applications received by the end of December. The Common App will change this benchmark. As of today, 54.7% of our processed fall freshman applications are via the Common App.
PERSPECTIVE:
The Fall 2023 TOTAL freshman application count = 7064.
For Fall 2024, freshman applications processed = 8614.
- As of today, there are 452 apps in queue to be processed. (Two weeks ago: 1465)
- 75% of those 452 are Common Apps.
- All applications (NMU and Common App) are caught up to within 13 business days of submission, and that gap will start to close more quickly now that the processors have worked through the highest submission dates.
First-year/Freshman applications: 8614 (+3198; +59% compared to the same point in time for Fall 2023)
Campus-based applications: 8516; 98.9% of total. [Fall 2023: 98.4% of total at this point in time]
First-year/Freshman admissions: 6929 (+3402; +96%) compared to the same point in time for Fall 2023)
First-year/Freshman orientation registrations: 130 (-8; -5.8%)
Transfer applications: 335 (-11; -3% compared to the same point in time for Fall 2023)
Campus-based applications: 300; 89.6% of total. [Fall 2023: 92.6% of total at this point in time]
Transfer admissions: 135 (-7; -5% compared to the same point in time for Fall 2023)
Transfer orientation registrations: 15 (+4)
Multi-year view:
| Fall 2017 11/30/16 | Fall 2018 11/29/17 | Fall 2019 11/28/18 | Fall 2020 11/27/19 | Fall 2021 12/2/20 | Fall 2022 12/1/21 | Fall 2023 11/30/22 | Fall 2024 11/29/23 | |
| Freshman Applications | 4520 | 5750 | 5815 | 4648 | 4854 | 4700 | 5416 | 8614 |
| Freshman Admits | 2975 | 3335 | 3352 | 2741 | 3089 | 3134 | 3527 | 6929 |
| % incomplete apps -F | 33% | 41% | 41% | 39% | 36% | 33% | 34% | 19% |
| Freshman Orientation Reg | 41 | 54 | 118 | 98 | 132 | 128 | 138 | 130 |
| % of admits reg for orientation | 1.4% | 1.6% | 3.5% | 3.6% | 4.3% | 4.1% | 3.9% | 1.9% |
| % of final fall reg for orientation | 2.7% | 3.4% | 7.4% | 7.2% | 8.9% | 9.1% | 8.9% | |
| Final Yield - % of admits enrolled | 33% | 32% | 32% | 32% | 32% | 32% | 32% | |
| New Freshman fall enrollment | 1501 | 1608 | 1601 | 1354 | 1491 | 1407 | 1542 | |
| Transfer Applications | 331 | 517 | 451 | 354 | 343 | 330 | 346 | 335 |
| Transfer Admits | 104 | 127 | 110 | 127 | 144 | 130 | 142 | 135 |
| % incomplete apps -T | 68% | 74% | 75% | 62% | 56% | 60% | 57% | 58% |
| Transfer Orientation Reg | 4 | 4 | 4 | 7 | 15 | 14 | 11 | 15 |
| % of admits reg for orientation | 3.8% | 3.1% | 3.6% | 5.5% | 10.4% | 10.8% | 7.7% | 11.1% |
| % of final fall reg for orientation | 1.0% | 0.8% | 1.0% | 1.8% | 4.2% | 3.6% | 2.5% | |
| Final Yield - % of admits enrolled | 61% | 61% | 60% | 56% | 54% | 55% | 56% | |
| Transfer fall enrollment | 407 | 488 | 419 | 393 | 360 | 386 | 440 | |
| Point-in-Cycle - New Freshmen | Fall 2017 | Fall 2018 | Fall 2019 | Fall 2020 | Fall 2021 | Fall 2022 | Fall 2023 | Fall 2024 |
| Final total fall freshman apps | 6345 | 7791 | 7837 | 6389 | 6693 | 6340 | 7063 | |
| % of total fall freshman apps received as of this date | 71.2% | 73.8% | 74.2% | 72.8% | 72.5% | 74.1% | 76.7% | |
| Final total fall freshman admits | 4591 | 5001 | 5035 | 4169 | 4670 | 4386 | 4848 | |
| % of total freshman fall admits received as of this date | 64.8% | 66.7% | 66.6% | 65.7% | 66.1% | 71.5% | 72.8% | |
| Point-in-Cycle - Transfers | Fall 2017 | Fall 2018 | Fall 2019 | Fall 2020 | Fall 2021 | Fall 2022 | Fall 2023 | Fall 2024 |
| Final total fall transfer apps | 1173 | 1574 | 1363 | 1229 | 1169 | 1216 | 1371 | |
| % of total fall transferapps received as of this date | 28.2% | 32.8% | 33.1% | 28.8% | 29.3% | 27.1% | 25.2% | |
| Final total fall transfer admits | 668 | 801 | 702 | 701 | 672 | 700 | 787 | |
| % of total fall transferadmits received as of this date | 15.6% | 15.9% | 15.7% | 18.0% | 21.4% | 18.6% | 18.0% | |
| FAFSA switched to 10/1 in 2016 for those applying for fall 2017; College app/FAFSA access initiatives increased in MI in 2018-19 | First able to advertise and admit to MEDP in summer 2017 for fall 2017 | Full marketing & appl cycle for MEDP | First fall with test blind policy fully adopted | July 1, 2023 - Eliminated application fee; Joined Common App for 2024 apps. | ||||
| Orientation opened in mid-November. |
Common App Q&A
Q: Do transfer students use the Common App to apply to NMU?
A: No. NMU is accepting the Common App from first-year/new freshmen (domestic, campus-based) for Winter 2024 and Fall 2024. (The Common App opens terms each August for the following year.)
Q. Is the volume of applications unique to NMU?
A. No. See below.
Early Common App Data Show Sharp Increase In College Applications
Inside Higher Ed (11/16, Knox) reports preliminary data from the Common App – “which counts about one-third of America’s four-year undergraduate institutions as members – show a sharp increase in applications submitted before Nov. 1, a jump of 41 percent over the 2019-20 application cycle.” Applications from minority students “increased 67 percent,” while applications from students “at high schools in lower-income ZIP codes also rose more than the general rate: 52 percent since 2019-20, versus 32 percent from wealthier ZIP codes.” The number of individual students using the Common App “increased 12 percent year over year, and those from underrepresented racial and ethnic groups rose by 21 percent.” However, one college leader “cautioned that it may reflect the growing popularity of early action and early decision – and increased pressure on students to apply to a longer list of colleges – rather than portend a comparable spike in enrollments next year.”
Additional Context for Fall 2024 – Changes in the financial aid cycle
Last year at this time, NMU had received FAFSA information from 1,702 fall 2023 admitted students (see chart below) and by December 20, 2022, the Financial Aid team sent financial aid offers to 1,788 students. For Fall 2024 admits, it is predicted that universities will not receive FAFSA information until late January. The later timeline for admitted students to receive financial aid offers (from all schools) is very likely to impact decision timelines and the indicators such as orientation registration. More information about the FAFSA changes can be found here.
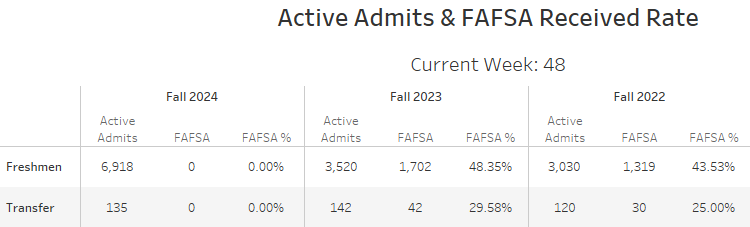
Please let me know if you have questions about the reports or any of the comments above.
Gerri
Winter 2024 and Fall 2024 Weekly Application Reports - November 23, 2023
Undergraduate Application Reports: November 23, 2023
Link to Reports for Winter 2024 and Fall 2024
- These numbers include Global Campus students and international students.
- Orientation registration reports for Winter and Fall are included.
- Comparing November 23, 2022 to November 22, 2023
The narrative will return for the November 30 reports.
Winter 2024 and Fall 2024 Weekly Application Reports - November 16, 2023
Undergraduate Application Reports: November 16, 2023
Link to Reports for Winter 2024 and Fall 2024
- These numbers include Global Campus students and international students.
- New this cycle: We will show application count totals in the narrative, and also break out the counts for campus-based (non-Global Campus) applications. This will help us track our progress on initiatives that are designed to impact the campus-based first-year and transfer populations.
- Orientation registration is open for 2024 winter semester admits and summer/fall semester admits. Winter semester orientation counts are included in this report. We will include fall orientation registrations starting November 30.
Winter 2024 – Comparing November 16, 2022 to November 15, 2023
Point in cycle: In Winter 2023, enrollment included 50 first-year/freshmen and 109 transfer students. By mid-November, we usually have received about 89% of our freshman applications and 79% of our transfer applications for winter.
First-year/Freshman applications: 352 (+77; +28% compared to last year at this time for Winter 2023)
Campus-based applications: 264; 75% of total. [Winter 2023: 78.2% of total at this point in time]
First-year/Freshman admissions: 100 (+20; +25% compared to last year at this time for Winter 2023)
First-year/Freshman orientation registrations: 35 (+6)
Transfer applications: 458 (+102; +29% compared to last year at this time for Winter 2023)
Campus-based applications: 241; 52.6% of total. [Winter 2023: 66.0% of total at this point in time]
Transfer admissions: 184 (+32; +21% compared to last year at this time for Winter 2023)
Transfer orientation registrations: 65 (+11)
Fall 2024 - Comparing November 16, 2022 to November 15, 2023
Point in cycle: Admissions outreach and communication is focused on application generation and completion and encouraging visits to campus. Over 1100 off-campus outreach activities have been conducted since August 1, 2023 – primarily college fairs, and visits to high schools and community colleges.
Historically, we could expect 80% of our fall freshman applications and 30% of our transfer fall applications in by the end of December. The Common App will change this benchmark. As of today, 48.9% of our processed fall freshman applications are via the Common App.
PERSPECTIVE:
The Fall 2023 TOTAL freshman application count = 7064.
For Fall 2024, we have received 7263 (processed in Banner) + 1465 (not yet processed) = 8728.
- As of this morning, there were 1465 fall apps in queue to be processed. (Last week: 2190 – GREAT progress!)
- 88% of those 1465 are Common Apps.
- 63% of those were submitted on or just before the November 1 deadline used by some colleges.
- Today, our staff is working on Common Apps submitted on October 30. The really big submission days were Oct. 29, 30, 31, so it is taking some time to get through those dates.
- Applications via NMU’s app are processed through November 9.
- Freshman admissions have remained steadily ahead – Three weeks ago, +518; Two weeks ago, +803; last week, +1411; this week, +2001.
First-year/Freshman applications: 7263 (+2116; +41% compared to the same point in time for Fall 2023)
Campus-based applications: 7172; 98.7% of total. [Fall 2023: 98.3% of total at this point in time]
First-year/Freshman admissions: 5283 (+2001; +61%) compared to the same point in time for Fall 2023)
Transfer applications: 298 (-15; -5% compared to the same point in time for Fall 2023)
Campus-based applications: 267; 89.6% of total. [Fall 2023: 93.6% of total at this point in time]
Transfer admissions: 119 (-3; -2% compared to the same point in time for Fall 2023)
Multi-year view – apps and admits:
| Fall 2018 11/15/17 | Fall 2019 11/21/18 | Fall 2020 11/20/19 | Fall 2021 11/18/20 | Fall 2022 11/17/21 | Fall 2023 11/16/22 | Fall 2024 11/15/23 | |
| Freshman Applications | 5110 | 5657 | 4455 | 4383 | 4421 | 5147 | 7263 |
| Freshman Admits | 2887 | 3135 | 2563 | 2753 | 2874 | 3282 | 5283 |
| New Freshman fall enrollment | 1608 | 1601 | 1354 | 1491 | 1407 | 1542 | |
| Transfer Applications | 428 | 427 | 338 | 289 | 295 | 313 | 298 |
| Transfer Admits | 100 | 102 | 111 | 124 | 108 | 122 | 119 |
| Transfer fall enrollment | 488 | 419 | 393 | 360 | 386 | 440 |
Common App Q&A
Q: Does an applicant using the Common App take intentional action to apply to NMU?
A: Yes, the student completes the Common App itself, which has MANY questions (educational history, parents, academic interests, etc.) and spots for essays and such. This core app is completed once. The student can search for and research member institutions by a number of criteria and add colleges they are interested in to their dashboard. Then they actively select the institution(s) they want to apply to and complete the institution-specific questions. For NMU, it is things like entry term, major (from our list), and a few other items.
Presidential Scholars Competition Re-cap
October 29-30 – Virtual – 35 attended.
November 5-6 - On-campus - 220 attended.
November 12-13 – On-campus – 244 attended.
Total attendance: 499 - Participants hailed from 24 states – from sea to shining sea!
Thank-you to everyone who supported these events in various ways: information fair, room set-up, AV, small groups, interviews, panels, tours, food, extra meetings, printing, mailing, forms, registration…it’s a lot. We appreciate you!
We have received lots of positive feedback that specifically mentions being impressed with the engaging, friendly, and informative interactions experienced during their time on campus.
Please let me know if you have questions about the reports or any of the comments above.
Gerri
Winter 2024 and Fall 2024 Weekly Application Reports - November 9, 2023
Undergraduate Application Reports: November 9, 2023
Link to Reports for Winter 2024 and Fall 2024
- These numbers include Global Campus students and international students.
- New this cycle: We will show application count totals in the narrative, and also break out the counts for campus-based (non-Global Campus) applications. This will help us track our progress on initiatives that are designed to impact the campus-based first-year and transfer populations.
- Orientation registration is open for 2024 winter semester admits and summer/fall semester admits. Winter semester orientation counts are included in this report. We will include fall orientation registrations in a few weeks and offer context based on the point in the cycle.
Winter 2024 – Comparing November 9, 2022 to November 8, 2023
Point in cycle: By early November, we usually will have received about 82% of our winter freshman applications and 68% of the winter transfer applications. In Winter 2023, enrollment included 50 first-year/freshmen and 109 transfer students. Winter applications are prioritized and processed within a day or two of submission. These include dual/concurrent enrollment applications.
First-year/Freshman applications: 336 (+68; +25% compared to last year at this time for Winter 2023)
Campus-based applications: 251; 74.7% of total. [Winter 2023: 79.5% of total at this point in time]
First-year/Freshman admissions: 98 (+20; +26% compared to last year at this time for Winter 2023)
First-year/Freshman orientation registrations: 32 (+8)
Transfer applications: 415 (+82; +25% compared to last year at this time for Winter 2023)
Campus-based applications: 217; 52.3% of total. [Winter 2023: 67.0% of total at this point in time]
Transfer admissions: 164 (+23; +16% compared to last year at this time for Winter 2023)
Transfer orientation registrations: 57 (+10)
Fall 2024 - Comparing November 9, 2022 to November 8, 2023
Point in cycle: Admissions outreach and communication is focused on application generation and completion and encouraging visits to campus.
Historically, we could expect 80% of our fall freshman applications and 30% of our transfer fall applications in by the end of December. The Common App will change this benchmark. As of today, 44.5% of our processed fall freshman applications are via the Common App.
- There was a large change again in the year-over-year difference in freshman applications. Three weeks ago, the difference was +440; two weeks ago, it was +71; last week it was +312; today it is +1337.
- As of this morning, there were 2190 applications in queue to be processed. (Last week: 3100)
- 81% of those 2190 are Common Apps.
- 81% of the total apps in the queue for processing were submitted prior to Nov 2, especially in the three days prior to the Nov. 1 deadline used by many selective institutions.
- Today, we are processing applications submitted on October 26-27. The really big submission days were Oct. 29, 30, 31, so it will take some time to get through those dates (1400 apps unprocessed for those three dates).
- Our three processors are working overtime; our executive administrative assistant/former processor is also contributing overtime hours and has onboarded more student employees/hours to assist with the resulting increase in mailings. Financial Aid staff are helping too. Our two receptionists are integral to getting those admission packets in the mail. Close to 600 admission packets were stuffed and mailed on Monday. Wow and THANK-YOU! What a team!
- The application submission volume dropped off after Nov. 2, and we're seeing about equal numbers of NMU applications and Common App submissions, ranging approx. 50-80 total applications per day now - a bit more normal.
- Freshman admissions have remained steadily ahead – Two weeks ago +518; Last week +803; this week +1411.
PERSPECTIVE:
The Fall 2023 TOTAL freshman application count = 7064.
For Fall 2024, we have received 6217 (processed in Banner) + 2100 (not yet processed) = 8317.
(Oh, crystal ball, where are ye?)
First-year/Freshman applications: 6217 (+1337; +27% compared to the same point in time for Fall 2023)
Campus-based applications: 6138; 98.7% of total. [Fall 2023: 98.5% of total at this point in time]
First-year/Freshman admissions: 4331 (+1411; +48%) compared to the same point in time for Fall 2023)
Transfer applications: 278 (-12; -4% compared to the same point in time for Fall 2023)
Campus-based applications: 249; 89.6% of total. [Fall 2023: 93.1% of total at this point in time]
Transfer admissions: 108 (-2; -2% compared to the same point in time for Fall 2023)
Multi-year view – apps and admits:
| Fall 2018 11/8/17 | Fall 2019 11/7/18 | Fall 2020 11/6/19 | Fall 2021 11/11/20 | Fall 2022 11/10/21 | Fall 2023 11/9/22 | Fall 2024 11/8/23 | |
| Freshman Applications | 4765 | 4977 | 3884 | 4097 | 4192 | 4880 | 6217 |
| Freshman Admits | 2605 | 2654 | 2083 | 2520 | 2658 | 2920 | 4331 |
| New Freshman fall enrollment | 1608 | 1601 | 1354 | 1491 | 1407 | 1542 | |
| Transfer Applications | 377 | 353 | 276 | 262 | 271 | 290 | 278 |
| Transfer Admits | 83 | 77 | 87 | 114 | 98 | 110 | 108 |
| Transfer fall enrollment | 488 | 419 | 393 | 360 | 386 | 440 |
In case you’re curious, for Fall 2024, freshmen apps, processed in Banner through the end of yesterday, 11/8:
We have Common Apps from 34 states.
We have apps from 13 additional states + DC - which are NMU apps only.
AR, KS, ND, NE, ID, MS, MT, NM, WA, WY, CT, KY, WV and DC
States with the highest number of Common Apps submitted:
MI - 2141 (46% of our total MI apps)
IL - 232 (62% of our total IL apps)
WI - 151 (33% of our total WI apps)
MN - 66 (34% of our total MN apps)
Other states with a Common App to total app ratio higher than >= 50%:
CO - 13/24
DE - 3/3
FL - 22/39
IN - 33/52
LA - 3/3
ME - 1/1
NC - 4/4
NY - 9/10
OH - 40/73
OK - 2/3
OR 2/4
PA - 8/13
UT - 1/1
VA - 7/11
Presidential Scholars Competition
October 29-30 – Virtual – 35 completed the competition.
November 5-6 – On-campus – 220 completed the competition.
November 12-13 – On-campus – 262 confirmed for this weekend.
We have received lots of positive feedback, very specific to the engaging, friendly, and informative interactions students and their parents or other supporters experienced during their time on campus for the competition. Thank-you!
Please let me know if you have questions about the reports or any of the comments above.
Gerri
Winter 2024 and Fall 2024 Weekly Application Reports - November 2, 2023
Undergraduate Application Reports: November 2, 2023
Link to Reports for Winter 2024 and Fall 2024
- These numbers include Global Campus students and international students.
- New this cycle: We will show application count totals in the narrative, and also break out the counts for campus-based (non-Global Campus) applications. This will help us track our progress on initiatives that are designed to impact the campus-based first-year and transfer populations.
- Orientation registration is open for 2024 winter semester admits and summer/fall semester admits. Winter semester orientation counts are included in this report. We will include fall orientation registrations in a few weeks and offer context based on the point in the cycle.
Winter 2024 – Comparing November 2, 2022 to November 1, 2023
Point in cycle: By early November, we usually will have received about 82% of our winter freshman applications and 68% of the winter transfer applications. In Winter 2023, enrollment included 50 first-year/freshmen and 109 transfer students. For Winter 2024, there were only 29 unprocessed applications as of this morning, as they prioritize those first.
First-year/Freshman applications: 329 (+76; +30% compared to last year at this time for Winter 2023)
Campus-based applications: 247; 75.1% of total. [Winter 2023: 79.4% of total at this point in time]
First-year/Freshman admissions: 93 (+16; +21% compared to last year at this time for Winter 2023)
First-year/Freshman orientation registrations: 31 (+12)
Transfer applications: 397 (+92; +30% compared to last year at this time for Winter 2023)
Campus-based applications: 211; 53.1% of total. [Winter 2023: 66.9% of total at this point in time]
Transfer admissions: 155 (+28; +22% compared to last year at this time for Winter 2023)
Transfer orientation registrations: 44 (+2)
The Talent Together and Grow Your Own education initiatives continue to have a positive impact on Global Campus transfer applications.
Fall 2024 - Comparing November 2, 2022 to November 1, 2023
Point in cycle: Admissions outreach and communication is focused on application generation and completion and encouraging visits to campus. Historically, we could expect 80% of our fall freshman applications and 30% of our transfer fall applications in by the end of December. We don’t know how the Common App will change this benchmark. As of today, 40.5% of our fall freshman applications are via the Common App.
- There was a large change again in the year-over-year difference in freshman applications. Two weeks ago, the difference was +440; last week it was +71; this week it is +312.
- As of this morning, there were 3100 applications in queue to be processed! (As a comparison, on 11/1/22, there were 375 applications in the queue.)
- 76% of those 3100 are Common Apps and about 50% were submitted since 10/29…the final days prior to the November 1 deadlines used by selective institutions.
- Our three processors worked a collective 67.5 hours of overtime in the past 7 days, and this will continue.
- Freshman admissions for fall have remained steadily ahead – Last week +518; This week +803.
First-year/Freshman applications: 4824 (+312; +7% compared to the same point in time for Fall 2023)
Campus-based applications: 3921; 98.4% of total. [Fall 2023: 98.5% of total at this point in time]
First-year/Freshman admissions: 3340 (+803; +32%) compared to the same point in time for Fall 2023)
Transfer applications: 238 (-24; -9% compared to the same point in time for Fall 2023)
Campus-based applications: 212; 89.1% of total. [Fall 2023: 92.7% of total at this point in time]
Transfer admissions: 94 (-5; -5% compared to the same point in time for Fall 2023)
Multi-year view – apps and admits:
| Fall 2018 11/1/17 | Fall 2019 10/31/18 | Fall 2020 10/30/19 | Fall 2021 11/4/20 | Fall 2022 11/3/21 | Fall 2023 11/2/22 | Fall 2024 11/2/23 | |
| Freshman Applications | 4163 | 4365 | 3514 | 3766 | 3809 | 4512 | 4824 |
| Freshman Admits | 2197 | 2249 | 1799 | 2187 | 2355 | 2537 | 3340 |
| New Freshman fall enrollment | 1608 | 1601 | 1354 | 1491 | 1407 | 1542 | |
| Transfer Applications | 337 | 319 | 253 | 251 | 242 | 262 | 238 |
| Transfer Admits | 80 | 75 | 84 | 106 | 83 | 99 | 94 |
| Transfer fall enrollment | 488 | 419 | 393 | 360 | 386 | 440 |
Presidential Scholars Competition
October 29-30 – Virtual – 35 completed the competition.
November 5-6 – On-campus – 229 registered
November 12-13 – On-campus – 276 registered
Thank-you to all who are supporting this event!
Please let me know if you have questions about the reports or any of the comments above.
Gerri
Winter 2024 and Fall 2024 Weekly Application Reports - October 26, 2023
Undergraduate Application Reports: October 26, 2023
Link to Reports for Winter 2024 and Fall 2024
- These numbers include Global Campus students and international students.
- New this cycle: We will show application count totals in the narrative, and also break out the counts for campus-based (non-Global Campus) applications. This will help us track our progress on initiatives that are designed to impact the campus-based first-year and transfer populations.
- Orientation registration is open for 2024 winter semester admits and summer/fall semester admits. Winter semester orientation counts are included in this report. We will include fall orientation registrations in a few weeks and offer context based on the point in the cycle.
Winter 2042 – Comparing October 26, 2022 to October 25, 2023
Point in cycle: By early November, we usually will have received about 82% of our winter freshman applications and 68% of the winter transfer applications. In Winter 2023, enrollment included 50 first-year/freshmen and 109 transfer students.
First-year/Freshman applications: 308 (+56; +22% compared to last year at this time for Winter 2023)
Campus-based applications: 229; 74.4% of total. [Winter 2023: 79.8% of total at this point in time]
First-year/Freshman admissions: 88 (+15; +21% compared to last year at this time for Winter 2023)
First-year/Freshman orientation registrations: 24 (+8)
Transfer applications: 376 (+81; +27% compared to last year at this time for Winter 2023)
Campus-based applications: 205; 54.5% of total. [Winter 2023: 66.4% of total at this point in time]
Transfer admissions: 148 (+29; +24% compared to last year at this time for Winter 2023)
Transfer orientation registrations: 33 (-1)
Notice the change compared to last year in percentage of campus-based applications versus Global Campus applications as a share of the total. The Talent Together and Grow Your Own education initiatives continue to have a positive impact on Global Campus transfer applications.
Fall 2024 - Comparing October 26, 2022 to October 25, 2023
Point in cycle: Admissions outreach and communication activity continues to focus on inquiry and application generation and encouraging visits to campus. We can expect 80% of our fall freshman applications and 30% of our transfer fall applications in by the end of December.
NOTE: There was a large change in the year-over-year difference in freshman applications. Last week, the difference was +440; this week it is +71. We expected that joining the Common Application was going to take us for a bit of a roller coaster ride. Our processors are working on applications submitted on October 14-15. There are approximately 1900 apps received but not yet processed – so they are not reflected in the numbers below. There have been some days in the past week with high volume submissions. The processors are working on Winter 2024 applications first since there’s a large percentage of Global Campus applications and registration for them opens on Monday.
With no application fee, some of the processing goes more quickly. With the Common App, the processing takes longer for each application. It's October - so lots of external initiatives are pushing apps in a narrow window - especially with some colleges having November 1 deadlines. With the Presidential Scholars competition approaching, time is being spent checking for applications and transcripts from registrants not yet admitted.
Processing overtime is starting today.
First-year/Freshman applications: 3985 (+71; +2% compared to the same point in time for Fall 2023)
Campus-based applications: 3921; 98.4% of total. [Fall 2023: 98.5% of total at this point in time]
First-year/Freshman admissions: 2663 (+518; +24%) compared to the same point in time for Fall 2023)
Transfer applications: 219 (-20; -8% compared to the same point in time for Fall 2023)
Campus-based applications: 194; 88.6% of total. [Fall 2023: 93.3% of total at this point in time]
Transfer admissions: 88 (+1; +1% compared to the same point in time for Fall 2023)
Multi-year view – apps and admits:
| Fall 2018 10/25/17 | Fall 2019 10/24/18 | Fall 2020 10/23/19 | Fall 2021 10/28/20 | Fall 2022 10/27/21 | Fall 2023 10/26/22 | Fall 2024 10/25/23 | |
| Freshman Applications | 3840 | 3955 | 3023 | 3343 | 3338 | 3914 | 3985 |
| Freshman Admits | 1805 | 1863 | 1529 | 1906 | 1944 | 2145 | 2663 |
| New Freshman fall enrollment | 1608 | 1601 | 1354 | 1491 | 1407 | 1542 | |
| Transfer Applications | 315 | 302 | 237 | 228 | 231 | 239 | 219 |
| Transfer Admits | 78 | 70 | 73 | 99 | 73 | 87 | 88 |
| Transfer fall enrollment | 488 | 419 | 393 | 360 | 386 | 440 |
Presidential Scholars Competition
October 29-30 – Virtual (registration closed)
November 5-6 – On-campus (registration closed)
November 12-13 – On-campus (registration closes on 10/30)
As of today, 467 students have applied for the competition. Last fall, 561 students competed.
Please let me know if you have questions about the reports or any of the comments above.
Gerri
Winter 2024 and Fall 2024 Weekly Application Reports - October 19, 2023
Undergraduate Application Reports: October 19, 2023
Link to Reports for Winter 2024 and Fall 2024
A few notes about these reports:
- These numbers include Global Campus students and international students.
- New this cycle: We will show application count totals in the narrative, and also break out the counts for campus-based (non-Global Campus) applications. This will help us track our progress on initiatives that are designed to impact the campus-based first-year and transfer populations.
- Orientation registration is open for 2024 winter semester admits and summer/fall semester admits. We will include those numbers in a few weeks and offer context based on the point in the cycle.
- I am happy to answer questions or talk through reports – x1464 or gdaniels@nmu.edu.
Winter 2024
Point in cycle: By early November, we usually will have received about 82% of our winter freshman applications and 68% of the winter transfer applications. In Winter 2023, enrollment included 50 first-year/freshmen and 109 transfer students.
First-year/Freshman applications: 292 (+54; +23% compared to last year at this time for Winter 2023)
Campus-based applications: 215; 73.6% of total. [Winter 2023: 79.8% of total]
First-year/Freshman admissions: 82 (+17; +26% compared to last year at this time for Winter 2023)
Transfer applications: 344 (+70; +26% compared to last year at this time for Winter 2023)
Campus-based applications: 188; 54.7% of total. [Winter 2023: 66.1% of total]
Transfer admissions: 141 (+29; +26% compared to last year at this time for Winter 2023)
Notice the change in percentage of campus-based applications versus Global Campus applications as a share of the total.
There is a bigger impact on the winter semester since Global Campus students tend to apply closer to their intended term. The Talent Together and Grow Your Own education initiatives continue to have a positive impact on Global Campus transfer applications.
Fall 2024
Point in cycle: Admissions outreach and communication activity continues to focus on inquiry and application generation and encouraging visits to campus. We can expect 80% of our fall freshman applications and 30% of our transfer fall applications in by the end of December.
There are several initiatives designed to generate more applications – and may do so at a volume where we will work to understand the impact on our comparisons to prior cycles. Most notably:
- Membership in the Common Application (impacts campus-based new freshmen applications)
- Since high schools are able to upload official transcripts via the Common App, many applications are arriving with transcripts, thereby moving applications to complete status – ready for a decision – more quickly. This is certainly impacting our “admit” numbers.
- Increased outreach, especially in national markets
- So far, there are increases from many states outside MI/WI/IL/MN – most notably from Indiana, Ohio, Florida, Missouri, Tennessee and Texas.
- Elimination of undergraduate application fee
- This also contributes to applications being complete and ready for a decision more quickly.
First-year/Freshman applications: 3649 (+440; +14% compared to the same point in time for Fall 2023)
Campus-based applications: 3592; 98.4% of total. [Fall 2023: 98.6% of total]
First-year/Freshman admissions: 2293 (+584; +34%) compared to the same point in time for Fall 2023)
Transfer applications: 204 (-7; -3% compared to the same point in time for Fall 2023)
Campus-based applications: 181; 88.7% of total. [Fall 2023: 93.8% of total]
Transfer admissions: 77 (+2; +3% compared to the same point in time for Fall 2023)
Multi-year view – apps and admits:
| Fall 2018 10/25/17 | Fall 2019 10/24/18 | Fall 2020 10/23/19 | Fall 2021 10/21/20 | Fall 2022 10/21/21 | Fall 2023 10/19/22 | Fall 2024 10/18/23 | |
| Freshman Applications | 3840 | 3955 | 3023 | 2864 | 2857 | 3209 | 3649 |
| Freshman Admits | 1805 | 1863 | 1529 | 1592 | 1605 | 1709 | 2293 |
| New Freshman fall enrollment | 1608 | 1601 | 1354 | 1491 | 1407 | 1542 | |
| Transfer Applications | 315 | 302 | 237 | 215 | 197 | 211 | 204 |
| Transfer Admits | 78 | 70 | 73 | 91 | 65 | 75 | 77 |
| Transfer fall enrollment | 488 | 419 | 393 | 360 | 386 | 440 |
Wildcat Weekend
THANK-YOU, EVERYONE! All accounts and feedback point to a very successful Wildcat Weekend and that is due to all of the attention and time and care so many people across campus invested in the event. Our student attendance was 239.
There have been 35 in-person Wildcat Weekend events since 2005 (fall and spring), averaging 247 students. Feedback is being collected from those who attended and we will share any department-specific details collected in a few weeks. In the meantime, here’s one example of the types of unsolicited feedback we have received. This is an email sent from a parent to one of our admissions counselors:
Thanks again for pulling us aside today and taking the time to answer our questions and tell Jemma a little about what NMU might be like for her. We were so impressed by the welcome from the staff and students today — everyone from the president to the psych professors to the tour guides was helpful and knowledgeable. I’ve been on a lot of college tours, and I’ve never noticed this level of engagement and personal commitment before. Kudos to the entire admissions staff, and thanks again to you for your perspective. We’re glad we made the trip from Grand Rapids!
Best,
Stephanie D.
Up next…
Presidential Scholars Competition
October 29-30 – Virtual
November 5-6 – On-campus
November 12-13 – On-campus
As of today, 354 students have applied for the competition. This is another event supported by many faculty, staff and NMU students. It could not happen without you and we are grateful for your support.
Please let me know if you have questions about the reports or any of the comments above.
Gerri
Winter 2024 and Fall 2024 Weekly Application Reports - October 12, 2023
Undergraduate Application Reports: October 12, 2023
LInk to Reports for Winter 2024 and Fall 2024
A few notes about these reports:
- These numbers include Global Campus students and international students.
- New this cycle: We will show fall application count totals in the narrative, and also break out the counts for campus-based (non-Global Campus) applications. This will help us track our progress on initiatives that are designed to impact the campus-based first-year and transfer populations.
- Orientation registration is now open for 2024 winter semester admits and summer/fall semester admits. We will include those numbers in a few weeks and offer context based on the point in the cycle.
- I am happy to answer questions or talk through reports – x1464 or gdaniels@nmu.edu.
Winter 2024
Point in cycle: In early October, we have typically received about 65% of our winter freshman apps and 50% of our transfer applications. That grows to 82% and 68% respectively by early November. In Winter 2023, enrollment included 50 first-year/freshmen and 109 transfer students.
First-year/Freshman applications: 275 (+57; +26% compared to last year at this time for Winter 2023)
Campus-based applications: 205; 74.5% of total. [Winter 2023: 80.7% of total]
First-year/Freshman admissions: 78 (+15; +24% compared to last year at this time for Winter 2023)
Transfer applications: 327 (+78; +31% compared to last year at this time for Winter 2023)
Campus-based applications: 180; 55% of total. [Winter 2023: 67.1% of total]
Transfer admissions: 128 (+22; +21% compared to last year at this time for Winter 2023)
Notice the change in percentage of campus-based applications versus Global Campus applications as a share of the total.
There is a bigger impact on the winter semester since Global Campus students tend to apply closer to their intended term.
Fall 2024
Point in cycle: This is very early in terms of attaching a lot of meaning to application and admission numbers for predicting outcomes for the following fall, but the importance of building a robust “top of the funnel” can’t be overstated. During this time, our outreach and communications activity focuses on inquiry and application generation and encouraging visits to campus. We can expect 80% of our fall freshman applications and 30% of our transfer fall applications in by the end of December.
There are several initiatives designed to generate more applications – and may do so at a volume where we will work to understand the impact on our comparisons to prior cycles. Most notably:
- Membership in the Common Application (impacts campus-based new freshmen applications)
- Since high schools are able to upload official transcripts via the Common App, many applications are arriving with transcripts, thereby moving applications to complete status – ready for a decision – more quickly. This is certainly impacting our “admit” numbers.
- Increased outreach, especially in national markets
- So far, there are increases from many states outside MI/WI/IL/MN – most notably from Indiana, Ohio, Florida, Missouri, Tennessee and Texas.
- Elimination of undergraduate application fee
- This also contributes to applications being complete and ready for a decision more quickly.
First-year/Freshman applications: 3049 (+579; +23% compared to the same point in time for Fall 2023)
Campus-based applications: 3004; 98.5% of total. [Fall 2023: 98.3% of total]
First-year/Freshman admissions: 1816 (+523; +40%) compared to the same point in time for Fall 2023)
Transfer applications: 196 (+7; +4% compared to the same point in time for Fall 2023)
Campus-based applications: 175; 89.3% of total. [Fall 2023: 93.7% of total]
Transfer admissions: 72 (+6; +9% compared to the same point in time for Fall 2023)
Multi-year view – apps and admits:
| Fall 2018 10/11/17 | Fall 2019 10/17/18 | Fall 2020 10/16/19 | Fall 2021 10/14/20 | Fall 2022 10/13/21 | Fall 2023 10/12/22 | Fall 2024 10/11/23 | |
| Freshman Applications | 2830 | 3266 | 2585 | 2533 | 2469 | 2470 | 3049 |
| Freshman Admits | 1332 | 1490 | 1260 | 1344 | 1331 | 1293 | 1816 |
| New Freshman fall enrollment | 1608 | 1601 | 1354 | 1491 | 1407 | 1542 | |
| Transfer Applications | 244 | 276 | 220 | 203 | 179 | 189 | 196 |
| Transfer Admits | 60 | 63 | 69 | 84 | 62 | 66 | 72 |
| Transfer fall enrollment | 488 | 419 | 393 | 360 | 386 | 440 |
October 13-14 – Wildcat Weekend
As of today, 306 students are registered, and with guests, the total count is 799. We will have no-shows and walk-ins….and it WILL be a GREAT day to be a Wildcat! (No matter the forecast of rain and wind…) Thanks to all who are supporting this event in every way, shape and form.
October 16-20 – National Transfer Student Week
See how NMU is celebrating transfer students during this effort recommended by the National Institute for the Study of Transfer Students.
Presidential Scholars Competition
October 29-30 – Virtual
November 5-6 – On-campus
November 12-13 – On-campus
Fun Fact: Of the 1,542 first-time new freshmen this fall, 388 are the only one from their high school new to NMU this fall. Adventurous spirits? Not inclined to follow the crowd? Teeny-tiny high schools? Must be from far, far away?
168 are from Michigan schools. 62 are from Wisconsin schools.
Our enrollment is built on a lot of ones and twos.
Here is the list of high schools from which we receive double-digit new freshmen enrollments (not all are 2023 high school grads, especially from Marquette Senior High School, but all are new freshmen):
| L.P. | Clarkston Senior High School | 10 |
| L.P. | Lake Orion High School | 10 |
| Bark River-Harris Schools | 10 | |
| Houghton High School | 10 | |
| Menominee Area High School | 10 | |
| West Iron County High School | 11 | |
| L.P. | Caledonia High School | 12 |
| L.P. | Petoskey High School | 14 |
| L.P. | Traverse City West Senior HS | 14 |
| L.P. | Grand Haven High School | 14 |
| Iron Mountain High School | 14 | |
| Ishpeming High School | 16 | |
| Westwood High School | 19 | |
| Gwinn High School | 21 | |
| Kingsford High School | 21 | |
| Negaunee High School | 30 | |
| Marquette Senior High School | 92 |
Shout out to Construction Management faculty on their outreach leading to very consistent Clarkston enrollments!
Please let me know if you have questions about the reports or any of the comments above.
Gerri
Winter 2024 and Fall 2024 Weekly Application Reports - October 5, 2023
Undergraduate Application Reports: October 5, 2023
LInk to Reports for Winter 2024 and Fall 2024
Hello, Everyone,
This is the time of year when we restart the weekly application reporting.
A few notes about these reports:
- These numbers include Global Campus students and international students.
- New this cycle: I will show fall application count totals in the narrative, and also break out the counts for campus-based (non-Global Campus) applications. This will help us track our progress on initiatives that are designed to impact the campus-based first-year and transfer populations.
- Orientation registration is scheduled to open within the next week for both winter admits and summer/fall admits. Once that occurs, we will add orientation registration reporting and will offer context based on the point in the cycle and timing compared to the prior cycle.
- I am happy to answer questions or talk through reports – x1464 or gdaniels@nmu.edu.
Thank-you to everyone who contributed to the efforts that led to NMU’s fall 2023 enrollment of 1,982 new freshmen and transfer students.
Winter 2024
Point in cycle: In early October, we have typically received about 65% of our winter freshman apps and 50% of our transfer applications. That grows to 82% and 68% respectively by early November. In Winter 2023, enrollment included 50 first-year/freshmen and 109 transfer students.
First-year/Freshman applications: 259 (+49; +23% compared to last year at this time for Winter 2023)
First-year/Freshman admissions: 73 (+15; +26% compared to last year at this time for Winter 2023)
Transfer applications: 305 (+70; +30% compared to last year at this time for Winter 2023)
Transfer admissions: 119 (+22; +23% compared to last year at this time for Winter 2023)
Fall 2024
Point in cycle: Early October is considered very early in terms of attaching a lot of meaning to application and admission numbers for predicting outcomes for the following fall, but the importance of building a robust “top of the funnel” can’t be overstated. During this time, our outreach and communications activity focuses on inquiry and application generation and encouraging visits to campus.
There are several initiatives designed to generate more applications – and may do so at a volume where we will work to understand the impact on our comparisons to prior cycles. Most notably:
- Membership in the Common Application (impacts campus-based first-year/new freshmen applications)
- Increased outreach, especially in national markets.
- Elimination of undergraduate application fee
First-year/Freshman applications: 2477 (+450; +22% compared to the same point in time for Fall 2023)
Campus-based applications: 2439 (98.5% of total)
First-year/Freshman admissions: 1394 (+320; +30%) compared to the same point in time for Fall 2023)
Transfer applications: 177 (+4; +2% compared to the same point in time for Fall 2023)
Campus-based applications: 156 (88.1% of total)
Transfer admissions: 65 (+5; +8% compared to the same point in time for Fall 2023)
The transfer application cycle for fall picks up steam in December/January as students complete their fall semesters.
Upcoming recruitment activities
October 13-14 – Wildcat Weekend
As of today, 270 students are registered (with guests, the count is 700+).
October 16-20 – National Transfer Student Week
See how NMU is celebrating transfer students during this effort recommended by the National Institute for the Study of Transfer Students.
October 29-30 – Virtual Presidential Scholars Competition
November 5-6 – Presidential Scholars Competition
November 12-13 – Presidential Scholars Competition
We appreciate your engagement with campus visitors and during these events. We are also looking forward to some upcoming recruitment collaborations with faculty and staff in various departments. If you have an idea…let’s chat!
Please let me know if you have questions about the reports or any of the comments above.
Gerri
Fall 2023 Weekly Application Reports - August 24, 2023
Fall 2023 Weekly Application Reports – August 24, 2023 (Click to see reports)
Hello, Everyone,
Here are the weekly application reports comparing August 23, 2023 to August 24, 2022 for the fall semester.
A few notes about the reports:
- These numbers include Global Campus students and international students.
- Feel free to share with your NMU colleagues.
- I am happy to answer questions or talk through reports – x1464 or gdaniels@nmu.edu.
Fall 2023
First-year/Freshman applications: 7055 (+724; +11%) compared to the same point in time for Fall 2022.
Last week: 7047 (+723; +11%)
First-year/Freshman admissions: 4855 (+461; +10%) compared to the same point in time for Fall 2022.
Last week: 4857 (+471; +11%)
Orientation registrations: 1547 (+126; +8.9%) compared to the same point in time for Fall 2022.
Last week: 1557 (+150; +10.7%)
Transfer applications: 1354 (+148; +12%) compared to the same point in time for Fall 2022.
Last week: 1348 (+150; +13%)
Transfer admissions: 775 (+74; +11%) compared to the same point in time for Fall 2022.
Last week: 762 (+67; +10%)
Orientation registrations: 488 (+86; +21.4%) compared to the same point in time for Fall 2022.
Last week: 469 (+74; +18.7%)
Note: As a reminder, Global Campus transfer applications related to the Talent Together and Grown Your Own programs are driving the increases in transfer student activity.
Excluding Global Campus students, these are the counts of active admits who have either completed orientation or have registered for the final or online orientation:
First-year/new freshmen = 1496
Transfers = 282
You will also see some declines in numbers week over week. For example, first-year admissions were at 4857 last week and 4855 this week. That reflects students changing their term (for example – from fall 2023 to winter 2024).
Multi-year view:
Note the fall semester start dates for 2020 and 2021.

Please let us know if you have questions about anything in this report.
This is the final fall 2023 report from Admissions.
Institutional Effectiveness will report enrollment counts on the first day and 10th day.
Thanks to everyone – all across campus – who have supported all enrollment efforts in all the ways. Best wishes to all as the fall semester begins!
Fall 2023 Weekly Application Reports - August 17, 2023
Fall 2023 Weekly Application Reports – August 17, 2023 (Click to see attachments)
Hello, Everyone,
Here are the weekly application reports comparing August 16, 2023 to August 17, 2022 for the fall semester.
A few notes about the reports:
- These numbers include Global Campus students and international students.
- Feel free to share with your NMU colleagues.
- I am happy to answer questions or talk through reports – x1464 or gdaniels@nmu.edu.
Fall 2023
First-year/Freshman applications: 7047 (+723; +11%) compared to the same point in time for Fall 2022.
Last week: 7036 (+723; +11%)
First-year/Freshman admissions: 4857 (+471; +11%) compared to the same point in time for Fall 2022.
Last week: 4849 (+465; +11%)
Orientation registrations: 1557 (+150; +10.7%) compared to the same point in time for Fall 2022.
Last week: 1544 (+140; +10.0%)
Transfer applications: 1348 (+150; +13%) compared to the same point in time for Fall 2022.
Last week: 1334 (+148; +12%)
Transfer admissions: 762 (+67; +10%) compared to the same point in time for Fall 2022.
Last week: 748 (+57; +8%)
Orientation registrations: 469 (+74; +18.7%) compared to the same point in time for Fall 2022.
Last week: 445 (+60; +15.6%)
Note: As a reminder, Global Campus transfer applications related to the Talent Together and Grown Your Own programs are driving the increases in the transfer metrics.
Excluding Global Campus students, these are the counts of active admits who have either completed orientation or have registered for the final or online orientation:
First-year/new freshmen = 1515
Transfers = 279
Orientation – August 23
Move-in – August 24
First Day – August 28
Institutional Effectiveness will report enrollment counts on the first day and 10th day.
The day of fall 2023 admissions reporting here will be August 26.
Note the fall semester start dates for 2020 and 2021.
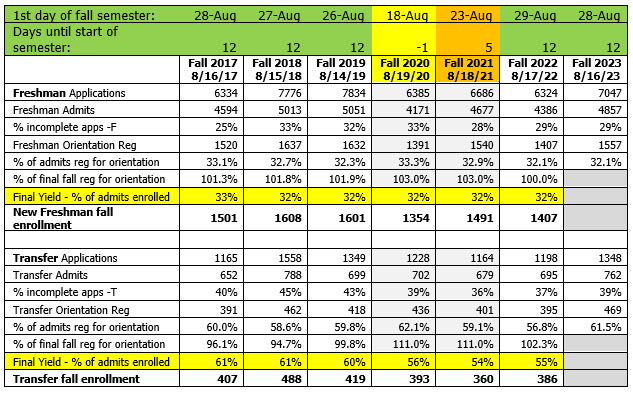
Please let us know if you have any questions about this report.
Thanks to everyone for all the hard work leading up to the fall semester!
Fall 2023 Weekly Application Reports - August 10, 2023
Fall 2023 Weekly Application Reports – August 10, 2023 (Click to see attachments)
Hello, Everyone,
Here are the weekly application reports comparing August 9, 2023 to August 10, 2022 for the fall semester.
A few notes about the reports:
- These numbers include Global Campus students and international students.
- Feel free to share with your NMU colleagues.
- I am happy to answer questions or talk through reports – x1464 or gdaniels@nmu.edu.
Fall 2023
First-year/Freshman applications: 7036 (+723; +11%) compared to the same point in time for Fall 2022.
Last week: 7023 (+719; +11%)
First-year/Freshman admissions: 4849 (+465; +11%) compared to the same point in time for Fall 2022.
Last week: 4840 (+449; +10%)
Orientation registrations: 1544 (+140; +10.0%) compared to the same point in time for Fall 2022.
Last week: 1527 (+127; +9.1%)
Transfer applications: 1334 (+148; +12%) compared to the same point in time for Fall 2022.
Last week: 1322 (+156; +13%)
Transfer admissions: 748 (+57; +8%) compared to the same point in time for Fall 2022.
Last week: 722 (+44; +6%)
Orientation registrations: 445 (+60; +15.6%) compared to the same point in time for Fall 2022.
Last week: 394 (+23; +6.2%)
Note: You can see that there has been an increase in transfer orientation registrations following the uptick in transfer applications and admissions due to an influx of Global Campus applications as part of two programs to help address the teacher shortage in Michigan. NMU is a partner and Joe Lubig is the NMU point person.
- Talent Together is a state budgeted program with two paths: Applied Workplace Leadership K-5 Licensure; Applied Workplace Leadership Bachelors to Access LD Graduate Program.
- Grow Your Own is a grant-funded program through Michigan with the path Applied Workplace Leadership Bachelors for K-5 elementary licensure or to Access LD or ECE Graduate Program.
Thanks to Joe, Jessi and others in the School of Ed, and also to Emilee and team in Global Campus, along with Paul and the Admissions processors – lots of work and lots of follow-up with applicants to get them all set for fall.
Excluding Global Campus students, these are the counts of active admits who have either completed orientation or have registered for the final or online orientation:
First-year/new freshmen = 1496
Transfers = 278
You can see the significant impact the Global Campus is having on transfer student counts.
There were some modest gains in first-year/new freshman taking late action registering for the August orientation. Looking at August history, those will waiver a bit and we might see some melt on those.
Housing – These include only students who are still active admits for fall 2023.
Total Freshman/Transfer/Non-Degree housing applications ($50): 1529
Total Freshman/Transfer/Non-Degree advance payments ($200): 1491 (97.5% of total housing applications)
Orientation – August 23
Move-in – August 24
First Day – August 28
Institutional Effectiveness will report enrollment counts on the first day and 10th day.
The day of fall 2023 admissions reporting here will be August 26.
Multi-year view:
|
|
Fall 2017 8/9/17 |
Fall 2018 8/8/18 |
Fall 2019 8/7/19 |
Fall 2020 8/12/20 |
Fall 2021 8/11/21 |
Fall 2022 8/10/22 |
Fall 2023 8/9/23 |
|
Freshman Applications |
6328 |
7768 |
7827 |
6375 |
6682 |
6313 |
7036 |
|
Freshman Admits |
4592 |
5007 |
5045 |
4176 |
4680 |
4384 |
4849 |
|
% incomplete apps -F |
25% |
33% |
32% |
32% |
28% |
29% |
29% |
|
Freshman Orientation Reg |
1498 |
1616 |
1618 |
1398 |
1531 |
1404 |
1544 |
|
% of admits reg for orientation |
32.6% |
32.3% |
32.1% |
33.5% |
32.7% |
32.0% |
31.8% |
|
% of final fall reg for orientation |
99.8% |
100.5% |
101.1% |
103.2% |
102.7% |
99.8% |
|
|
Final Yield - % of admits enrolled |
33% |
32% |
32% |
32% |
32% |
32% |
|
|
New Freshman fall enrollment |
1501 |
1608 |
1601 |
1354 |
1491 |
1407 |
|
|
|
|
|
|
|
|
|
|
|
Transfer Applications |
1154 |
1547 |
1337 |
1215 |
1151 |
1186 |
1334 |
|
Transfer Admits |
644 |
782 |
698 |
694 |
677 |
691 |
748 |
|
% incomplete apps -T |
40% |
45% |
42% |
39% |
35% |
37% |
40% |
|
Transfer Orientation Reg |
385 |
451 |
404 |
430 |
400 |
385 |
445 |
|
% of admits reg for orientation |
59.8% |
57.7% |
57.9% |
62.0% |
59.1% |
55.7% |
59.5% |
|
% of final fall reg for orientation |
94.6% |
92.4% |
96.4% |
109.4% |
111.1% |
99.7% |
|
|
Final Yield - % of admits enrolled |
61% |
61% |
60% |
56% |
54% |
55% |
|
|
Transfer fall enrollment |
407 |
488 |
419 |
393 |
360 |
386 |
|
|
|
|
|
|
|
|
|
|
|
Point-in-Cycle - New Freshmen |
Fall 2017 |
Fall 2018 |
Fall 2019 |
Fall 2020 |
Fall 2021 |
Fall 2022 |
Fall 2023 |
|
Final total fall freshman apps |
6345 |
7791 |
7837 |
6389 |
6693 |
6340 |
|
|
% of total fall freshman apps received as of this date |
99.7% |
99.7% |
99.9% |
99.8% |
99.8% |
99.6% |
|
|
Final total fall freshman admits |
4591 |
5001 |
5035 |
4169 |
4670 |
4386 |
|
|
% of total freshman fall admits received as of this date |
100.0% |
100.1% |
100.2% |
100.2% |
100.0% |
99.9% |
|
|
Point-in-Cycle - Transfers |
Fall 2017 |
Fall 2018 |
Fall 2019 |
Fall 2020 |
Fall 2021 |
Fall 2022 |
Fall 2023 |
|
Final total fall transfer apps |
1173 |
1574 |
1363 |
1229 |
1169 |
1216 |
|
|
% of total fall transfer apps received as of this date |
98.4% |
98.3% |
98.1% |
98.9% |
98.5% |
97.5% |
|
|
Final total fall transfer admits |
668 |
801 |
702 |
701 |
672 |
700 |
|
|
% of total fall transfer admits received as of this date |
96.4% |
97.6% |
99.4% |
99.0% |
100.7% |
98.7% |
|
|
FAFSA switched to 10/1 in 2016 for those applying for fall 2017; College app/FAFSA access initiatives increased in MI in 2018-19 |
|
First able to advertise and admit to MEDP in summer 2017 for fall 2017 |
Full marketing & appl cycle for MEDP |
|
|
First fall with test blind policy fully adopted |
|
Please let us know if you have questions about anything in this report.
Fall 2023 Weekly Application Reports - August 3, 2023
Fall 2023 Weekly Application Reports – August 3, 2023
Hello, Everyone,
Here are the weekly application reports comparing August 2, 2023 to August 3, 2022 for the fall semester.
A few notes about the reports:
- These numbers include Global Campus students and international students.
- Feel free to share with your NMU colleagues.
- I am happy to answer questions or talk through reports – x1464 or gdaniels@nmu.edu.
Fall 2023
First-year/Freshman applications: 7023 (+719; +11%) compared to the same point in time for Fall 2022.
Last week: 7008 (+710; +11%)
First-year/Freshman admissions: 4840 (+449; +10%) compared to the same point in time for Fall 2022.
Last week: 4838 (+452; +10%)
Orientation registrations: 1527 (+127; +9.1%) compared to the same point in time for Fall 2022.
Last week: 1519 (+131; +9.4%)
Transfer applications: 1322 (+156; +13%) compared to the same point in time for Fall 2022.
Last week: 1213 (+58; +5%)
Transfer admissions: 722 (+44; +6%) compared to the same point in time for Fall 2022.
Last week: 630 (-40; -6%)
Orientation registrations: 394 (+23; +6.2%) compared to the same point in time for Fall 2022.
Last week: 341 (-19; -5.3%)
Note: The uptick in transfer applications, admissions, and orientation registrations is due to an influx of Global Campus applications as part of two programs to help address the teacher shortage in Michigan. NMU is a partner and Joe Lubig is the NMU point person.
- Talent Together is a state budgeted program with two paths: Applied Workplace Leadership K-5 Licensure; Applied Workplace Leadership Bachelors to Access LD Graduate Program.
- Grow Your Own is a grant-funded program through Michigan with the path Applied Workplace Leadership Bachelors for K-5 elementary licensure or to Access LD or ECE Graduate Program.
Thanks to Joe, Jessi and others in the School of Ed, and also to Emilee and team in Global Campus – lots of work and lots of follow-up with applicants to get them all set for fall.
Multi-year view:
|
|
Fall 2017 8/2/17 |
Fall 2018 8/1/18 |
Fall 2019 7/31/19 |
Fall 2020 8/5/20 |
Fall 2021 8/4/21 |
Fall 2022 8/3/22 |
Fall 2023 8/2/23 |
|
Freshman Applications |
6317 |
7763 |
7820 |
6372 |
6669 |
6304 |
7023 |
|
Freshman Admits |
4583 |
4999 |
5039 |
4178 |
4675 |
4391 |
4840 |
|
% incomplete apps -F |
25% |
33% |
32% |
32% |
28% |
29% |
29% |
|
Freshman Orientation Reg |
1486 |
1597 |
1604 |
1411 |
1512 |
1400 |
1527 |
|
% of admits reg for orientation |
32.4% |
31.9% |
31.8% |
33.8% |
32.3% |
31.8% |
31.5% |
|
% of final fall reg for orientation |
99.0% |
99.3% |
100.2% |
104.2% |
101.4% |
99.5% |
|
|
Final Yield - % of admits enrolled |
33% |
32% |
32% |
32% |
32% |
32% |
|
|
New Freshman fall enrollment |
1501 |
1608 |
1601 |
1354 |
1491 |
1407 |
|
|
|
|
|
|
|
|
|
|
|
Transfer Applications |
1146 |
1534 |
1323 |
1201 |
1139 |
1166 |
1322 |
|
Transfer Admits |
635 |
769 |
691 |
687 |
671 |
678 |
722 |
|
% incomplete apps -T |
41% |
45% |
43% |
39% |
35% |
37% |
41% |
|
Transfer Orientation Reg |
373 |
433 |
390 |
420 |
384 |
371 |
394 |
|
% of admits reg for orientation |
58.7% |
56.3% |
56.4% |
61.1% |
57.2% |
54.7% |
54.6% |
|
% of final fall reg for orientation |
91.6% |
88.7% |
93.1% |
106.9% |
106.7% |
96.1% |
|
|
Final Yield - % of admits enrolled |
61% |
61% |
60% |
56% |
54% |
55% |
|
|
Transfer fall enrollment |
407 |
488 |
419 |
393 |
360 |
386 |
|
|
|
|
|
|
|
|
|
|
|
Point-in-Cycle - New Freshmen |
Fall 2017 |
Fall 2018 |
Fall 2019 |
Fall 2020 |
Fall 2021 |
Fall 2022 |
Fall 2023 |
|
Final total fall freshman apps |
6345 |
7791 |
7837 |
6389 |
6693 |
6340 |
|
|
% of total fall freshman apps received as of this date |
99.6% |
99.6% |
99.8% |
99.7% |
99.6% |
99.4% |
|
|
Final total fall freshman admits |
4591 |
5001 |
5035 |
4169 |
4670 |
4386 |
|
|
% of total freshman fall admits received as of this date |
99.8% |
99.9% |
100.1% |
100.2% |
100.1% |
100.1% |
|
|
Point-in-Cycle - Transfers |
Fall 2017 |
Fall 2018 |
Fall 2019 |
Fall 2020 |
Fall 2021 |
Fall 2022 |
Fall 2023 |
|
Final total fall transfer apps |
1173 |
1574 |
1363 |
1229 |
1169 |
1216 |
|
|
% of total fall transfer apps received as of this date |
97.7% |
97.5% |
97.1% |
97.7% |
97.4% |
95.9% |
|
|
Final total fall transfer admits |
668 |
801 |
702 |
701 |
672 |
700 |
|
|
% of total fall transfer admits received as of this date |
95.1% |
96.0% |
98.4% |
98.0% |
99.9% |
96.9% |
|
|
FAFSA switched to 10/1 in 2016 for those applying for fall 2017; College app/FAFSA access initiatives increased in MI in 2018-19 |
|
First able to advertise and admit to MEDP in summer 2017 for fall 2017 |
Full marketing & appl cycle for MEDP |
|
|
First fall with test blind policy fully adopted |
|
Save the date!
Wildcat Weekend – October 13 – 14, 2023
Virtual Presidential Scholars Competition – October 29-30, 2023
Presidential Scholars Competition #1 – November 5 – 6, 2023
Presidential Scholars Competition #2– November 12- 13, 2023
Wildcat Weekend – March 15 – 16, 2024
Summer Counselors Visit - July 24-26, 2024
Please let us know if you have questions about anything in this report.
Fall 2023 Weekly Application Reports - July 27, 2023
Fall 2023 Weekly Application Reports – July 27, 2023
Hello, Everyone,
Here are the weekly application reports comparing July 26, 2023 to July 27, 2022 for the fall semester.
A few notes about the reports:
- These numbers include Global Campus students and international students.
- Feel free to share with your NMU colleagues.
- I am happy to answer questions or talk through reports – x1464 or gdaniels@nmu.edu.
Fall 2023
First-year/Freshman applications: 7008 (+710; +11%) compared to the same point in time for Fall 2022.
Last week: 6992 (+710; +11%)
First-year/Freshman admissions: 4838 (+452; +10%) compared to the same point in time for Fall 2022.
Last week: 4834 (+453; +10%)
Orientation registrations: 1519 (+131; +9.4%) compared to the same point in time for Fall 2022.
Last week: 1496 (+127; +9.3%)
Transfer applications: 1213 (+58; +5%) compared to the same point in time for Fall 2022.
Last week: 1142 (0; 0%)
Transfer admissions: 630 (-40; -6%) compared to the same point in time for Fall 2022.
Last week: 622 (-41; -6%)
Orientation registrations: 341 (-19; -5.3%) compared to the same point in time for Fall 2022.
Last week: 325 (-25; -7.1%)
Note: The uptick in transfer applications is due to an influx of Global Campus applications as part of two programs to help address the teacher shortage in Michigan. NMU is a partner and Joe Lubig is the NMU point person.
- Talent Together is a state budgeted program with two paths: Applied Workplace Leadership K-5 Licensure; Applied Workplace Leadership Bachelors to Access LD Graduate Program.
- Grow Your Own is a grant-funded program through Michigan with the path Applied Workplace Leadership Bachelors for K-5 elementary licensure or to Access LD or ECE Graduate Program.
An increase in the transfer admit count will occur as transcripts are received.
Multi-year view:
|
|
Fall 2017: 7/26/17 |
Fall 2018: 7/25/18 |
Fall 2019: 7/24/19 |
Fall 2020 7/29/20 |
Fall 2021: 7/28/21 |
Fall 2022: 7/27/22 |
Fall 2023 7/26/23 |
|
Freshman Applications |
6307 |
7737 |
7809 |
6361 |
6659 |
6298 |
7008 |
|
Freshman Admits |
4573 |
4989 |
5029 |
4172 |
4673 |
4386 |
4838 |
|
% incomplete apps -F |
25% |
33% |
32% |
32% |
28% |
29% |
29% |
|
Freshman Orientation Reg |
1467 |
1579 |
1589 |
1400 |
1493 |
1388 |
1519 |
|
% of admits reg for orientation |
32.1% |
31.6% |
31.6% |
33.6% |
31.9% |
31.6% |
31.4% |
|
% of final fall reg for orientation |
97.7% |
98.2% |
99.3% |
103.4% |
100.1% |
98.6% |
|
|
Final Yield - % of admits enrolled |
33% |
32% |
32% |
32% |
32% |
32% |
|
|
New Freshman fall enrollment |
1501 |
1608 |
1601 |
1354 |
1491 |
1407 |
|
|
|
|
|
|
|
|
|
|
|
Transfer Applications |
1135 |
1524 |
1311 |
1190 |
1128 |
1155 |
1213 |
|
Transfer Admits |
624 |
755 |
682 |
676 |
666 |
670 |
630 |
|
% incomplete apps -T |
41% |
46% |
43% |
39% |
35% |
37% |
44% |
|
Transfer Orientation Reg |
362 |
416 |
379 |
401 |
371 |
360 |
341 |
|
% of admits reg for orientation |
58.0% |
55.1% |
55.6% |
59.3% |
55.7% |
54.0% |
54.1% |
|
% of final fall reg for orientation |
88.9% |
85.2% |
90.4% |
102.0% |
103.1% |
93.3% |
|
|
Final Yield - % of admits enrolled |
61% |
61% |
60% |
56% |
54% |
55% |
|
|
Transfer fall enrollment |
407 |
488 |
419 |
393 |
360 |
386 |
|
|
|
|
|
|
|
|
|
|
|
Point-in-Cycle - New Freshmen |
Fall 2017 |
Fall 2018 |
Fall 2019 |
Fall 2020 |
Fall 2021 |
Fall 2022 |
Fall 2023 |
|
Final total fall freshman apps |
6345 |
7791 |
7837 |
6389 |
6693 |
6340 |
|
|
% of total fall freshman apps received as of this date |
99.4% |
99.3% |
99.6% |
99.6% |
99.5% |
99.3% |
|
|
Final total fall freshman admits |
4591 |
5001 |
5035 |
4169 |
4670 |
4386 |
|
|
% of total freshman fall admits received as of this date |
99.6% |
99.8% |
99.9% |
100.1% |
100.1% |
100.0% |
|
|
Point-in-Cycle - Transfers |
Fall 2017 |
Fall 2018 |
Fall 2019 |
Fall 2020 |
Fall 2021 |
Fall 2022 |
Fall 2023 |
|
Final total fall transfer apps |
1173 |
1574 |
1363 |
1229 |
1169 |
1216 |
|
|
% of total fall transfer apps received as of this date |
96.8% |
96.8% |
96.2% |
95.4% |
96.5% |
95.0% |
|
|
Final total fall transfer admits |
668 |
801 |
702 |
701 |
672 |
700 |
|
|
% of total fall transfer admits received as of this date |
93.4% |
94.3% |
97.2% |
94.9% |
99.1% |
95.7% |
|
|
FAFSA switched to 10/1 in 2016 for those applying for fall 2017; College app/FAFSA access initiatives increased in MI in 2018-19 |
|
First able to advertise and admit to MEDP in summer 2017 for fall 2017 |
Full marketing & appl cycle for MEDP |
|
|
First fall with test blind policy fully adopted |
|
Geographically, freshman orientation registrations are trending ahead of last year in these regions:
Michigan U.P. – Driven by gains in these counties: Alger, Delta, Dickinson, Houghton, Iron, Keweenaw, Luce, Menominee
Michigan L.P. – There are increases in all regions, and in terms of year-over-year gains, these counties lead the way: Leelenau, Roscommon, Ingham, Calhoun, Shiawassee, Livingston, Washtenaw, Macomb, Kent, Allegan, Muskegon
Wisconsin – Top counties in year-over-year gains: Oneida, Waupaca, Outagamie, Kenosha, Waukesha, Eau Claire, Walworth
Illinois – Driven by gains in our ILW region, primarily in Will County.
Minnesota – Largest gains in Washington County and St. Louis County.
Looking Ahead:
Summer Counselors Visit - July 26-28, 2023
Wildcat Weekend – October 13 – 14, 2023
Virtual Presidential Scholars Competition – October 29-30, 2023
Presidential Scholars Competition #1 – November 5 – 6, 2023
Presidential Scholars Competition #2– November 12- 13, 2023
Wildcat Weekend – March 15 – 16, 2024
Please let us know if you have questions about anything in this report.
Fall 2023 Weekly Application Reports - July 20, 2023
Fall 2023 Weekly Application Reports – July 20, 2023
Hello, Everyone,
Here are the weekly application reports comparing July 19, 2023 to July 20, 2022 for the fall semester.
A few notes about the reports:
- These numbers include Global Campus students and international students.
- Feel free to share with your NMU colleagues.
- I am happy to answer questions or talk through reports – x1464 or gdaniels@nmu.edu.
Fall 2023
First-year/Freshman applications: 6992 (+710; +11%) compared to the same point in time for Fall 2022.
Last week: 6981 (+711; +11%)
First-year/Freshman admissions: 4834 (+453; +10%) compared to the same point in time for Fall 2022.
Last week: 4820 (+443; +10%)
Orientation registrations: 1496 (+127; +9.3%) compared to the same point in time for Fall 2022.
Last week: 1476 (+120; +8.8%)
Transfer applications: 1142 (0; 0%) compared to the same point in time for Fall 2022.
Last week: 1111 (-9; -1%)
Transfer admissions: 622 (-41; -6%) compared to the same point in time for Fall 2022.
Last week: 601 (-44; -7%)
Orientation registrations: 325 (-25; -7.1%) compared to the same point in time for Fall 2022.
Last week: 307 (-21; -6.4%)
With 31 additional transfer applications received in the past week, it will be interesting to see how those complete and convert to admissions and orientation registrations.
Multi-year view:
|
|
Fall 2017 7/19/17 |
Fall 2018 7/18/18 |
Fall 2019 7/17/19 |
Fall 2020 7/22/20 |
Fall 2021 7/21/21 |
Fall 2022 7/20/22 |
Fall 2023 7/19/23 |
|
Freshman Applications |
6293 |
7726 |
7802 |
6346 |
6645 |
6282 |
6992 |
|
Freshman Admits |
4569 |
4979 |
5022 |
4162 |
4667 |
4381 |
4834 |
|
% incomplete apps -F |
25% |
33% |
33% |
32% |
28% |
29% |
29% |
|
Freshman Orientation Reg |
1444 |
1561 |
1573 |
1382 |
1476 |
1369 |
1496 |
|
% of admits reg for orientation |
31.6% |
31.4% |
31.3% |
33.2% |
31.6% |
31.2% |
30.9% |
|
% of final fall reg for orientation |
96.2% |
97.1% |
98.3% |
102.1% |
98.9% |
97.3% |
|
|
Final Yield - % of admits enrolled |
33% |
32% |
32% |
32% |
32% |
32% |
|
|
New Freshman fall enrollment |
1501 |
1608 |
1601 |
1354 |
1491 |
1407 |
|
|
|
|
|
|
|
|
|
|
|
Transfer Applications |
1124 |
1500 |
1291 |
1173 |
1122 |
1142 |
1142 |
|
Transfer Admits |
609 |
737 |
672 |
665 |
663 |
663 |
622 |
|
% incomplete apps -T |
42% |
46% |
44% |
40% |
35% |
37% |
41% |
|
Transfer Orientation Reg |
344 |
399 |
365 |
395 |
364 |
350 |
325 |
|
% of admits reg for orientation |
56.5% |
54.1% |
54.9% |
59.4% |
54.9% |
52.8% |
52.3% |
|
% of final fall reg for orientation |
84.5% |
81.8% |
87.1% |
100.5% |
101.1% |
90.7% |
|
|
Final Yield - % of admits enrolled |
61% |
61% |
60% |
56% |
54% |
55% |
|
|
Transfer fall enrollment |
407 |
488 |
419 |
393 |
360 |
386 |
|
|
|
|
|
|
|
|
|
|
|
Point-in-Cycle - New Freshmen |
Fall 2017 |
Fall 2018 |
Fall 2019 |
Fall 2020 |
Fall 2021 |
Fall 2022 |
Fall 2023 |
|
Final total fall freshman apps |
6345 |
7791 |
7837 |
6389 |
6693 |
6340 |
|
|
% of total fall freshman apps received as of this date |
99.2% |
99.2% |
99.6% |
99.3% |
99.3% |
99.1% |
|
|
Final total fall freshman admits |
4591 |
5001 |
5035 |
4169 |
4670 |
4386 |
|
|
% of total freshman fall admits received as of this date |
99.5% |
99.6% |
99.7% |
99.8% |
99.9% |
99.9% |
|
|
Point-in-Cycle - Transfers |
Fall 2017 |
Fall 2018 |
Fall 2019 |
Fall 2020 |
Fall 2021 |
Fall 2022 |
Fall 2023 |
|
Final total fall transfer apps |
1173 |
1574 |
1363 |
1229 |
1169 |
1216 |
|
|
% of total fall transfer apps received as of this date |
95.8% |
95.3% |
94.7% |
95.4% |
95.9% |
93.9% |
|
|
Final total fall transfer admits |
668 |
801 |
702 |
701 |
672 |
700 |
|
|
% of total fall transfer admits received as of this date |
91.2% |
92.0% |
95.7% |
94.9% |
98.7% |
94.7% |
|
|
FAFSA switched to 10/1 in 2016 for those applying for fall 2017; College app/FAFSA access initiatives increased in MI in 2018-19 |
|
First able to advertise and admit to MEDP in summer 2017 for fall 2017 |
Full marketing & appl cycle for MEDP |
|
|
First fall with test blind policy fully adopted |
|
Looking Ahead:
The Summer Counselor Visit is next week! After confirmation calls, there are 35 counselors (plus their families) joining us next week. In July 2022, 13 counselors attended. We will see what the actual attendance is when they check in next Tuesday. Thanks to everyone who has agreed to engage with them through sessions, meals, and the academic majors fair.
Summer Counselors Visit - July 26-28, 2023
Wildcat Weekend – October 13 – 14, 2023
Virtual Presidential Scholars Competition – October 29-30, 2023
Presidential Scholars Competition #1 – November 5 – 6, 2023
Presidential Scholars Competition #2– November 12- 13, 2023
Wildcat Weekend – March 15 – 16, 2024
Please let us know if you have questions about anything in this report.
Fall 2023 Weekly Application Reports - July 13, 2023
Fall 2023 Weekly Application Reports – July 13, 2023
Hello, Everyone,
Here are the weekly application reports comparing July 12, 2023 to July 13, 2022 for the fall semester.
A few notes about the reports:
- These numbers include Global Campus students and international students.
- Feel free to share with your NMU colleagues.
- I am happy to answer questions or talk through reports – x1464 or gdaniels@nmu.edu.
Fall 2023
First-year/Freshman applications: 6981 (+711; +11%) compared to the same point in time for Fall 2022.
Last week: 6961 (+703; +11%)
First-year/Freshman admissions: 4820 (+443; +10%) compared to the same point in time for Fall 2022.
Last week: 4767 (+392; +9%)
Orientation registrations: 1476 (+120; +8.8%) compared to the same point in time for Fall 2022.
Last week: 1447 (+113; +8.5%)
NOTE: You will notice the count of first-year admissions is a gain of 53 over the prior week. This jump is largely due to the completion of applications due to the removal of the application fee requirement as of July 1. We were therefore able to make admission decisions on those files that had the academic information necessary for a decision. Others are receiving communication about the policy change and are invited to provide the remaining information necessary for a decision.
Transfer applications: 1111 (-9; -1%) compared to the same point in time for Fall 2022.
Last week: 1080 (-23; -2%)
Transfer admissions: 601 (-44; -7%) compared to the same point in time for Fall 2022.
Last week: 579 (-50; -8%)
Orientation registrations: 307 (-21; -6.4%) compared to the same point in time for Fall 2022.
Last week: 288 (-19; -6.2%)
To provide a sense of anticipated activity, last year, between mid-July and the start of the semester, for the fall 2022 term, we received:
Freshman applications: 70
Freshman orientation registrations: 44
Transfer applications: 96
Transfer orientation registrations: 67
Multi-year view:
|
|
Fall 2017 7/12/17 |
Fall 2018 7/11/18 |
Fall 2019 7/10/19 |
Fall 2020 7/15/20 |
Fall 2021 7/14/21 |
Fall 2022 7/13/22 |
Fall 2023 7/12/23 |
|
Freshman Applications |
6278 |
7710 |
7780 |
6329 |
6636 |
6270 |
6981 |
|
Freshman Admits |
4551 |
4972 |
5005 |
4157 |
4660 |
4377 |
4820 |
|
% incomplete apps -F |
25% |
33% |
33% |
32% |
28% |
29% |
29% |
|
Freshman Orientation Reg |
1422 |
1547 |
1558 |
1357 |
1455 |
1356 |
1476 |
|
% of admits reg for orientation |
31.2% |
31.1% |
31.1% |
32.6% |
31.2% |
31.0% |
30.6% |
|
% of final fall reg for orientation |
94.7% |
96.2% |
97.3% |
100.0% |
97.6% |
96.4% |
|
|
Final Yield - % of admits enrolled |
33% |
32% |
32% |
32% |
32% |
32% |
|
|
New Freshman fall enrollment |
1501 |
1608 |
1601 |
1354 |
1491 |
1407 |
|
|
|
|
|
|
|
|
|
|
|
Transfer Applications |
1100 |
1474 |
1274 |
1150 |
1103 |
1120 |
1111 |
|
Transfer Admits |
601 |
713 |
657 |
649 |
651 |
645 |
601 |
|
% incomplete apps -T |
42% |
47% |
44% |
40% |
35% |
38% |
41% |
|
Transfer Orientation Reg |
332 |
385 |
347 |
379 |
350 |
328 |
307 |
|
% of admits reg for orientation |
55.2% |
54.0% |
52.8% |
58.4% |
53.8% |
50.9% |
51.1% |
|
% of final fall reg for orientation |
81.6% |
78.9% |
82.8% |
96.4% |
97.2% |
85.0% |
|
|
Final Yield - % of admits enrolled |
61% |
61% |
60% |
56% |
54% |
55% |
|
|
Transfer fall enrollment |
407 |
488 |
419 |
393 |
360 |
386 |
|
|
|
|
|
|
|
|
|
|
|
Point-in-Cycle - New Freshmen |
Fall 2017 |
Fall 2018 |
Fall 2019 |
Fall 2020 |
Fall 2021 |
Fall 2022 |
Fall 2023 |
|
Final total fall freshman apps |
6345 |
7791 |
7837 |
6389 |
6693 |
6340 |
|
|
% of total fall freshman apps received as of this date |
98.9% |
99.0% |
99.3% |
99.0% |
99.1% |
98.9% |
|
|
Final total fall freshman admits |
4591 |
5001 |
5035 |
4169 |
4670 |
4386 |
|
|
% of total freshman fall admits received as of this date |
99.1% |
99.4% |
99.4% |
99.7% |
99.8% |
99.8% |
|
|
Point-in-Cycle - Transfers |
Fall 2017 |
Fall 2018 |
Fall 2019 |
Fall 2020 |
Fall 2021 |
Fall 2022 |
Fall 2023 |
|
Final total fall transfer apps |
1173 |
1574 |
1363 |
1229 |
1169 |
1216 |
|
|
% of total fall transfer apps received as of this date |
93.8% |
93.6% |
93.5% |
93.6% |
94.4% |
92.1% |
|
|
Final total fall transfer admits |
668 |
801 |
702 |
701 |
672 |
700 |
|
|
% of total fall transfer admits received as of this date |
90.0% |
89.0% |
93.6% |
92.6% |
96.9% |
92.1% |
|
|
FAFSA switched to 10/1 in 2016 for those applying for fall 2017; College app/FAFSA access initiatives increased in MI in 2018-19 |
|
First able to advertise and admit to MEDP in summer 2017 for fall 2017 |
Full marketing & appl cycle for MEDP |
|
|
First fall with test blind policy fully adopted |
|
Housing application information - Another commitment indicator:
Fall 2023
Total Freshman/Transfer/Non-Degree housing applications ($50): 1498 (gained 35 in the past week)
Total Freshman/Transfer/Non-Degree advance payments ($200): 1442 (96% of total) (gained 32 in the past week)
Fall 2022 – Comparison data not available this week.
Looking ahead to Fall 2024 -a very early glance:
|
Student Type, Apps and Admits |
Fall 2021: 7/15/21 |
Fall 2022: 7/14/21 |
Fall 2023: 7/13/22 |
Fall 2024: 7/12/23 |
|
|
Freshmen |
Applications |
308 |
273 |
319 |
317 |
|
|
Admits |
80 |
97 |
87 |
91 |
|
Transfers |
Applications |
70 |
68 |
61 |
64 |
|
|
Admits |
18 |
21 |
13 |
19 |
Please let us know if you have questions about anything in this report.
Fall 2023 Weekly Application Reports - July 6, 2023
Fall 2023 Weekly Application Reports – July 6, 2023
Hello, Everyone,
Here are the weekly application reports comparing July 5, 2023 to July 6, 2022 for the fall semester.
A few notes about the reports:
- These numbers include Global Campus students and international students.
- Feel free to share with your NMU colleagues.
- I am happy to answer questions or talk through reports – x1464 or gdaniels@nmu.edu.
Fall 2023
First-year/Freshman applications: 6961 (+703; +11%) compared to the same point in time for Fall 2022.
Last week: 6952 (+703; +11%)
First-year/Freshman admissions: 4767 (+392; +9%) compared to the same point in time for Fall 2022.
Last week: 4745 (+374; +9%)
Orientation registrations: 1447 (+113; +8.5%) compared to the same point in time for Fall 2022.
Last week: 1448 (+121; +9.1%)
Note: This week's freshman orientation counts are -1 from last week, meaning we had more students withdraw (with an orientation registration) than we had newly registered. In June, freshman orientation registrations were -17 this year vs. last year; +7 in transfer orientation registrations.
Last year in the month of July we added 61 freshman registrations and 58 transfer registrations.
Transfer applications: 1080 (-23; -2%) compared to the same point in time for Fall 2022.
Last week: 1059 (-31; -3%)
Transfer admissions: 579 (-50; -8%) compared to the same point in time for Fall 2022.
Last week: 566 (-49; -8%)
Orientation registrations: 288 (-19; -6.2%) compared to the same point in time for Fall 2022.
Last week: 282 (-20; -6.6%)
Multi-year view:
|
|
Fall 2017 7/5/17 |
Fall 2018 7/4/18 |
Fall 2019 7/3/19 |
Fall 2020 7/8/20 |
Fall 2021 7/7/21 |
Fall 2022 7/6/22 |
Fall 2023 7/5/23 |
|
Freshman Applications |
6268 |
7697 |
7767 |
6305 |
6618 |
6258 |
6961 |
|
Freshman Admits |
4530 |
4966 |
4997 |
4147 |
4642 |
4375 |
4767 |
|
% incomplete apps -F |
25% |
33% |
33% |
32% |
28% |
28% |
30% |
|
Freshman Orientation Reg |
1397 |
1530 |
1549 |
1356 |
1423 |
1334 |
1447 |
|
% of admits reg for orientation |
30.8% |
30.1% |
31.0% |
32.7% |
30.7% |
30.5% |
30.30% |
|
% of final fall reg for orientation |
93.1% |
95.1% |
96.8% |
100.0% |
95.4% |
94.8% |
|
|
Final Yield - % of admits enrolled |
33% |
32% |
32% |
32% |
32% |
32% |
|
|
New Freshman fall enrollment |
1501 |
1608 |
1601 |
1354 |
1491 |
1407 |
|
|
|
|
|
|
|
|
|
|
|
Transfer Applications |
1083 |
1446 |
1267 |
1134 |
1083 |
1103 |
1080 |
|
Transfer Admits |
591 |
703 |
646 |
639 |
633 |
629 |
579 |
|
% incomplete apps -T |
42% |
48% |
45% |
40% |
36% |
38% |
42% |
|
Transfer Orientation Reg |
317 |
374 |
332 |
357 |
331 |
307 |
288 |
|
% of admits reg for orientation |
53.6% |
53.2% |
51.4% |
55.9% |
52.0% |
48.8% |
49.70% |
|
% of final fall reg for orientation |
77.9% |
76.6% |
79.2% |
90.8% |
91.9% |
79.5% |
|
|
Final Yield - % of admits enrolled |
61% |
61% |
60% |
56% |
54% |
55% |
|
|
Transfer fall enrollment |
407 |
488 |
419 |
393 |
360 |
386 |
|
|
|
|
|
|
|
|
|
|
|
Point-in-Cycle - New Freshmen |
Fall 2017 |
Fall 2018 |
Fall 2019 |
Fall 2020 |
Fall 2021 |
Fall 2022 |
Fall 2023 |
|
Final total fall freshman apps |
6345 |
7791 |
7837 |
6389 |
6693 |
6340 |
|
|
% of total fall freshman apps received as of this date |
98.8% |
98.8% |
99.1% |
99% |
98.9% |
98.7% |
|
|
Final total fall freshman admits |
4591 |
5001 |
5035 |
4169 |
4670 |
4386 |
|
|
% of total freshman fall admits received as of this date |
98.7% |
99.3% |
99.2% |
99.5% |
99.4% |
99.7% |
|
|
Point-in-Cycle - Transfers |
Fall 2017 |
Fall 2018 |
Fall 2019 |
Fall 2020 |
Fall 2021 |
Fall 2022 |
Fall 2023 |
|
Final total fall transfer apps |
1173 |
1574 |
1363 |
1229 |
1169 |
1216 |
|
|
% of total fall transfer apps received as of this date |
92.0% |
92.0% |
93.0% |
92.3% |
89.1% |
90.7% |
|
|
Final total fall transfer admits |
668 |
801 |
702 |
701 |
672 |
700 |
|
|
% of total fall transfer admits received as of this date |
88.0% |
88.0% |
92.0% |
91.2% |
94.2% |
89.9% |
|
|
FAFSA switched to 10/1 in 2016 for those applying for fall 2017; College app/FAFSA access initiatives increased in MI in 2018-19 |
|
First able to advertise and admit to MEDP in summer 2017 for fall 2017 |
Full marketing & appl cycle for MEDP |
|
|
First fall with test blind policy fully adopted |
|
Housing application information - Another commitment indicator:
Fall 2023
Total Freshman/Transfer/Non-Degree housing applications ($50): 1463 (gained 9 in the past week)
Total Freshman/Transfer/Non-Degree advance payments ($200): 1410 (96% of total) (gained 11 in the past week)
Fall 2022
Total Freshman/Transfer/Non-Degree housing applications ($50): 1346
Total Freshman/Transfer/Non-Degree advance payments ($200): 1278 (95% of total)
Application Fee News – Effective July 1, 2023, the undergraduate application fee requirement has been discontinued.
NMU has joined the ~100 four-year institutions in our Midwest markets (MI, WI, IL, MN) and the 475 Common App institutions nationally who do not charge an application fee. We are excited to remove this barrier to college admission.
Please let us know if you have questions about anything in this report.
Fall 2023 Weekly Application Reports - June 29, 2023
Fall Weekly Application Reports - June 29, 2023
Hello, Everyone,
Here are the weekly application reports comparing June 28, 2023 to June 29, 2022 for the fall semester.
A few notes about the reports:
- These numbers include Global Campus students and international students.
- Feel free to share with your NMU colleagues.
- I am happy to answer questions or talk through reports – x1464 or gdaniels@nmu.edu.
Fall 2023
First-year/Freshman applications: 6952 (+703; +11%) compared to the same point in time for Fall 2022.
Last week: 6941 (+703; +11%)
First-year/Freshman admissions: 4745 (+374; +9%) compared to the same point in time for Fall 2022.
Last week: 4744 (+390; +9%)
Orientation registrations: 1448 (+121; +9.1%) compared to the same point in time for Fall 2022.
Last week: 1424 (+117; +9.0%)
Transfer applications: 1059 (-31; -3%) compared to the same point in time for Fall 2022.
Last week: 1032 (-43; -4%)
Transfer admissions: 566 (-49; -8%) compared to the same point in time for Fall 2022.
Last week: 551 (-45; -8%)
Orientation registrations: 282 (-20; -6.6%) compared to the same point in time for Fall 2022.
Last week: 271 (-16; -5.6%)
Multi-year view:
|
|
Fall 2017 6/28/17 |
Fall 2018 6/27/18 |
Fall 2019 6/26/19 |
Fall 2020 7/1/20 |
Fall 2021 6/30/21 |
Fall 2022 6/29/22 |
Fall 2023 6/29/23 |
|
Freshman Applications |
6259 |
7686 |
7755 |
6284 |
6602 |
6249 |
6952 |
|
Freshman Admits |
4518 |
4960 |
4990 |
4136 |
4629 |
4371 |
4745 |
|
% incomplete apps -F |
25% |
33% |
33% |
32% |
28% |
28% |
30% |
|
Freshman Orientation Reg |
1379 |
1495 |
1533 |
1337 |
1418 |
1327 |
1448 |
|
% of admits reg for orientation |
30.5% |
30.1% |
30.7% |
32.0% |
30.6% |
30.4% |
30.5% |
|
% of final fall reg for orientation |
91.9% |
93.0% |
95.8% |
99.0% |
95.1% |
94.3 |
|
|
Final Yield - % of admits enrolled |
33% |
32% |
32% |
32% |
32% |
32% |
|
|
New Freshman fall enrollment |
1501 |
1608 |
1601 |
1354 |
1491 |
1407 |
|
|
|
|
|
|
|
|
|
|
|
Transfer Applications |
1068 |
1433 |
1257 |
1114 |
1073 |
1090 |
1059 |
|
Transfer Admits |
584 |
695 |
635 |
633 |
625 |
615 |
566 |
|
% incomplete apps -T |
42% |
48% |
46% |
40% |
36% |
39% |
42% |
|
Transfer Orientation Reg |
312 |
360 |
320 |
351 |
318 |
302 |
282 |
|
% of admits reg for orientation |
53.4% |
51.8% |
50.4% |
55.0% |
50.9% |
49.1% |
49.8% |
|
% of final fall reg for orientation |
76.7% |
73.8% |
76.4% |
89.0% |
88.3% |
78.2% |
|
|
Final Yield - % of admits enrolled |
61% |
61% |
60% |
56% |
54% |
55% |
|
|
Transfer fall enrollment |
407 |
488 |
419 |
393 |
360 |
386 |
|
|
|
|
|
|
|
|
|
|
|
Point-in-Cycle - New Freshmen |
Fall 2017 |
Fall 2018 |
Fall 2019 |
Fall 2020 |
Fall 2021 |
Fall 2022 |
Fall 2023 |
|
Final total fall freshman apps |
6345 |
7791 |
7837 |
6389 |
6693 |
6340 |
|
|
% of total fall freshman apps received as of this date |
99% |
99% |
99% |
98.0% |
98.6% |
98.6% |
|
|
Final total fall freshman admits |
4591 |
5001 |
5035 |
4169 |
4670 |
4386 |
|
|
% of total freshman fall admits received as of this date |
98% |
99% |
99% |
99.0% |
99.1% |
99.7% |
|
|
Point-in-Cycle - Transfers |
Fall 2017 |
Fall 2018 |
Fall 2019 |
Fall 2020 |
Fall 2021 |
Fall 2022 |
Fall 2023 |
|
Final total fall transfer apps |
1173 |
1574 |
1363 |
1229 |
1169 |
1216 |
|
|
% of total fall transfer apps received as of this date |
91% |
91% |
92% |
91.0% |
91.8% |
89.6% |
|
|
Final total fall transfer admits |
668 |
801 |
702 |
701 |
672 |
700 |
|
|
% of total fall transfer admits received as of this date |
87% |
87% |
90% |
90.0% |
93.0% |
87.9% |
|
|
FAFSA switched to 10/1 in 2016 for those applying for fall 2017; College app/FAFSA access initiatives increased in MI in 2018-19 |
|
First able to advertise and admit to MEDP in summer 2017 for fall 2017 |
Full marketing & appl cycle for MEDP |
|
|
First fall with test blind policy fully adopted |
|
Housing application information - Another commitment indicator:
Fall 2023
Total freshman/transfer/non-degree housing applications ($50): 1454 (gained 28 in the past week)
Total freshman/transfer/non-degree advance payments ($200): 1399 (96% of total) (gained 37 in the past week)
Application Fee News – Effective July 1, 2023, the undergraduate application fee requirement will be discontinued.
NMU will join the ~100 four-year institutions in our Midwest markets (MI, WI, IL, MN) and the 475 Common App institutions nationally who do not charge an application fee. We are excited to remove this barrier to college admission.
Please let us know if you have questions about anything in this report.
Fall 2023 Weekly Application Reports - June 22, 2023
Fall 2023 Weekly Application Reports – June 22, 2023
Hello, Everyone,
Here are the weekly application reports comparing June 21, 2023 to June 22, 2022 for the fall semester.
A few notes about the reports:
- These numbers include Global Campus students and international students.
- Feel free to share with your NMU colleagues.
- I am happy to answer questions or talk through reports – x1464 or gdaniels@nmu.edu.
Fall 2023:
First-year/Freshman applications: 6941 (+703; +11%) compared to the same point in time for Fall 2022.
Last week: 6919 (+689; +11%)
First-year/Freshman admissions: 4744 (+390; +9%) compared to the same point in time for Fall 2022.
Last week: 4722 (+391; +9%)
Orientation registrations: 1424 (+117; +9.0%) compared to the same point in time for Fall 2022.
Last week: 1394 (+113; +8.8%)
Transfer applications: 1032 (-43; -4%) compared to the same point in time for Fall 2022.
Last week: 1011 (-46; -4%)
Transfer admissions: 551 (-45; -8%) compared to the same point in time for Fall 2022.
Last week: 543 (-47; -8%)
Orientation registrations: 271 (-16; -5.6%) compared to the same point in time for Fall 2022.
Last week: 261 (-17; -6.1%)
Multi-year view:
|
|
Fall 2017 6/21/17 |
Fall 2018 6/20/18 |
Fall 2019 6/19/19 |
Fall 2020 6/24/20 |
Fall 2021 6/23/21 |
Fall 2022 6/22/22 |
Fall 2023 6/21/23 |
|
Freshman Applications |
6242 |
7666 |
7741 |
6266 |
6587 |
6238 |
6941 |
|
Freshman Admits |
4498 |
4950 |
4983 |
4117 |
4618 |
4354 |
4744 |
|
% incomplete apps -F |
26% |
33% |
33% |
32% |
28% |
29% |
30% |
|
Freshman Orientation Reg |
1333 |
1455 |
1494 |
1336 |
1397 |
1307 |
1424 |
|
% of admits reg for orientation |
29.6% |
29.4% |
30.0% |
32.5% |
30.3% |
30.0% |
30.0% |
|
% of final fall reg for orientation |
88.9% |
90.5% |
93.3% |
98.7% |
93.7% |
92.9% |
|
|
Final Yield - % of admits enrolled |
33% |
32% |
32% |
32% |
32% |
32% |
|
|
New Freshman fall enrollment |
1501 |
1608 |
1601 |
1354 |
1491 |
1407 |
|
|
|
|
|
|
|
|
|
|
|
Transfer Applications |
1054 |
1409 |
1239 |
1095 |
1054 |
1075 |
1032 |
|
Transfer Admits |
578 |
683 |
634 |
619 |
615 |
596 |
551 |
|
% incomplete apps -T |
42% |
48% |
45% |
40% |
36% |
40% |
42% |
|
Transfer Orientation Reg |
295 |
333 |
309 |
348 |
300 |
287 |
271 |
|
% of admits reg for orientation |
51.0% |
48.8% |
48.7% |
56.2% |
48.8% |
48.2% |
49.2% |
|
% of final fall reg for orientation |
72.5% |
68.2% |
73.7% |
88.5% |
83.3% |
74.4% |
|
|
Final Yield - % of admits enrolled |
61% |
61% |
60% |
56% |
54% |
55% |
|
|
Transfer fall enrollment |
407 |
488 |
419 |
393 |
360 |
386 |
|
|
|
|
|
|
|
|
|
|
|
Point-in-Cycle - New Freshmen |
Fall 2017 |
Fall 2018 |
Fall 2019 |
Fall 2020 |
Fall 2021 |
Fall 2022 |
Fall 2023 |
|
Final total fall freshman apps |
6345 |
7791 |
7837 |
6389 |
6693 |
6340 |
|
|
% of total fall freshman apps received as of this date |
98% |
98% |
99% |
98% |
98.4% |
98.4% |
|
|
Final total fall freshman admits |
4591 |
5001 |
5035 |
4169 |
4670 |
4386 |
|
|
% of total freshman fall admits received as of this date |
98% |
99% |
99% |
99% |
98.9% |
99.3% |
|
|
Point-in-Cycle - Transfers |
Fall 2017 |
Fall 2018 |
Fall 2019 |
Fall 2020 |
Fall 2021 |
Fall 2022 |
Fall 2023 |
|
Final total fall transfer apps |
1173 |
1574 |
1363 |
1229 |
1169 |
1216 |
|
|
% of total fall transfer apps received as of this date |
90% |
90% |
91% |
89% |
90.2% |
88.4% |
|
|
Final total fall transfer admits |
668 |
801 |
702 |
701 |
672 |
700 |
|
|
% of total fall transfer admits received as of this date |
87% |
85% |
90% |
88% |
91.5% |
85.1% |
|
|
FAFSA switched to 10/1 in 2016 for those applying for fall 2017; College app/FAFSA access initiatives increased in MI in 2018-19 |
|
First able to advertise and admit to MEDP in summer 2017 for fall 2017 |
Full marketing & appl cycle for MEDP |
|
|
First fall with test blind policy fully adopted |
|
Housing application information - Another commitment indicator:
Fall 2023:
Total freshman/transfer/non-degree housing applications ($50): 1426 (gained 24 in the past week)
Total freshman/transfer/non-degree advance payments ($200): 1362 (96% of total) (gained 34 in the past week)
Fall 2022:
Total freshman/transfer/non-degree housing applications ($50): 1299
Total freshman/transfer/non-degree advance payments ($200): 1223 (94% of total)
Application Fee News – Effective July 1, 2023, the undergraduate application fee requirement will be discontinued.
NMU will join the ~100 four-year institutions in our Midwest markets (MI, WI, IL, MN) and the 475 Common App institutions nationally who do not charge an application fee. We are excited to remove this barrier to college admission.
Please let me know if you have questions about anything in this report.
Fall 2023 Weekly Application Reports - June 15, 2023
Fall 2023 Weekly Application Reports – June 15, 2023
Hello, Everyone,
Here are the weekly application reports comparing June 14, 2023 to June 15, 2022 for the fall semester.
A few notes about the reports:
- These numbers include Global Campus students and international students.
- Feel free to share with your NMU colleagues.
- I am happy to answer questions or talk through reports – x1464 or gdaniels@nmu.edu.
Fall 2023
First-year/Freshman applications: 6919 (+689; +11%) compared to the same point in time for Fall 2022)
Last week: 6901 (+685; +11%)
First-year/Freshman admissions: 4722 (+391; +9%) compared to the same point in time for Fall 2022)
Last week: 4709 (+400; +9%)
Orientation registrations: 1394 (+113; +8.8%) compared to the same point in time for Fall 2022)
Last week: 1358 (+119; +9.6%)
Observation: For new freshmen, although still positive, we are not adding orientation registrations in June at the same pace we were last year (22 fewer over the first half of the month). We expect that we will continue and we will see the gains over last year get consistently smaller.
Transfer applications: 1011 (-46; -4%) compared to the same point in time for Fall 2022.
Last week: 986 (-45; -4%)
Transfer admissions: 543 (-47; -8%) compared to the same point in time for Fall 2022.
Last week: 527 (-44; -8%)
Orientation registrations: 261 (-17; -6.1%) compared to the same point in time for Fall 2022.
Last week: 248 (-15; -5.7%)
No-shows: For the orientation sessions completed as of 6/14/23, there have been 13 no-shows. This is the same as last year after 3 sessions. Orientation and Admissions staff follow up with each; some update to future sessions, others might change their application term, and others cancel their application.
Multi-year view:
|
|
Fall 2017 6/14/17 |
Fall 2018 6/13/18 |
Fall 2019 6/12/19 |
Fall 2020 6/17/20 |
Fall 2021 6/16/21 |
Fall 2022 6/15/22 |
Fall 2023 6/14/23 |
|
Freshman Applications |
6229 |
7644 |
7715 |
6242 |
6567 |
6230 |
6919 |
|
Freshman Admits |
4491 |
4941 |
4974 |
4095 |
4606 |
4331 |
4722 |
|
% incomplete apps -F |
26% |
33% |
33% |
33% |
28% |
29% |
30% |
|
Freshman Orientation Reg |
1264 |
1413 |
1431 |
1333 |
1386 |
1281 |
1394 |
|
% of admits reg for orientation |
28.1% |
28.6% |
28.8% |
32.6% |
30.1% |
29.6% |
29.5% |
|
% of final fall reg for orientation |
84.2% |
87.9% |
89.4% |
98.4% |
93.0% |
91.0% |
|
|
Final Yield - % of admits enrolled |
33% |
32% |
32% |
32% |
32% |
32% |
|
|
New Freshman fall enrollment |
1501 |
1608 |
1601 |
1354 |
1491 |
1407 |
|
|
|
|
|
|
|
|
|
|
|
Transfer Applications |
1043 |
1395 |
1226 |
1077 |
1037 |
1057 |
1011 |
|
Transfer Admits |
570 |
667 |
626 |
607 |
601 |
590 |
543 |
|
% incomplete apps -T |
42% |
48% |
46% |
40% |
37% |
40% |
42% |
|
Transfer Orientation Reg |
276 |
321 |
293 |
324 |
282 |
278 |
261 |
|
% of admits reg for orientation |
48.4% |
48.1% |
46.8% |
53.4% |
46.9% |
47.1% |
48.1% |
|
% of final fall reg for orientation |
67.8% |
65.8% |
69.9% |
82.4% |
78.3% |
72.0% |
|
|
Final Yield - % of admits enrolled |
61% |
61% |
60% |
56% |
54% |
55% |
|
|
Transfer fall enrollment |
407 |
488 |
419 |
393 |
360 |
386 |
|
|
|
|
|
|
|
|
|
|
|
Point-in-Cycle - New Freshmen |
Fall 2017 |
Fall 2018 |
Fall 2019 |
Fall 2020 |
Fall 2021 |
Fall 2022 |
Fall 2023 |
|
Final total fall freshman apps |
6345 |
7791 |
7837 |
6389 |
6693 |
6340 |
|
|
% of total fall freshman apps received as of this date |
98% |
98% |
98% |
98.0% |
98.1% |
98.3% |
|
|
Final total fall freshman admits |
4591 |
5001 |
5035 |
4169 |
4670 |
4386 |
|
|
% of total freshman fall admits received as of this date |
98% |
99% |
99% |
98.0% |
98.6% |
98.7% |
|
|
Point-in-Cycle - Transfers |
Fall 2017 |
Fall 2018 |
Fall 2019 |
Fall 2020 |
Fall 2021 |
Fall 2022 |
Fall 2023 |
|
Final total fall transfer apps |
1173 |
1574 |
1363 |
1229 |
1169 |
1216 |
|
|
% of total fall transfer apps received as of this date |
89% |
89% |
90% |
88% |
88.7% |
86.9% |
|
|
Final total fall transfer admits |
668 |
801 |
702 |
701 |
672 |
700 |
|
|
% of total fall transfer admits received as of this date |
85% |
83% |
89% |
87% |
89.4% |
84.3% |
|
|
FAFSA switched to 10/1 in 2016 for those applying for fall 2017; College app/FAFSA access initiatives increased in MI in 2018-19 |
|
First able to advertise and admit to MEDP in summer 2017 for fall 2017 |
Full marketing & appl cycle for MEDP |
|
|
First fall with test blind policy fully adopted |
|
Housing application information - Another commitment indicator:
Total freshman/transfer/non-degree housing applications ($50): 1402 (gained 25 in past week)
Total freshman/transfer/non-degree advance payments ($200): 1328 (95% of total) (gained 40 in the past week)
Freshman/non-degree housing applications: 1257; advance payments: 1191 (95%)
Last year: 1119; advance payments: 1062 (95%)
Transfer housing applications: 145; Transfer advance payments: 137 (94%)
Last year: 139; advance payments: 128 (92%)
Of the 1402 total freshman, transfers and non-degree students who applied for housing, 93% have registered for orientation ($126). Another 47 started orientation registration but did not complete it (did not pay the fee) so they are not yet considered registered.
Financial Aid
Mike Rotundo reports that 3,680 incoming students have been offered financial aid as of 6/2/23.
Tuition Advantage - 2023 high school graduates receiving the Michigan Achievement Scholarship and Pell Grant are eligible for the NMU Tuition Advantage; 144 have awards. So far, there’s about a 27% yield to orientation on these. We will continue to monitor.
Hosting counselors
Counselors are an influential bunch and NMU will be hosting high school counselors in June and July as follows:
Illinois Bus O’ Fun – This group visits 11 college campuses in 5 and NMU is a stop. We will host 27 counselors for a campus tour and lunch on July 21.
NMU Summer Counselor Visit will occur July 26-28 and 44 counselors are registered!
Thank you for supporting these programs!
Please let me know if you have questions about anything in this report.
Gerri
Fall 2023 Weekly Application Reports - June 8, 2023
Fall 2023 Weekly Application Reports – June 8, 2023
Hello, Everyone,
Here are the weekly application reports comparing June 7, 2023 to June 8, 2022 for the fall semester.
A few notes about the reports:
- These numbers include Global Campus students and international students.
- Feel free to share with your NMU colleagues.
- I am happy to answer questions or talk through reports – x1464 or gdaniels@nmu.edu.
Fall 2023
First-year/Freshman applications: 6901 (+685; +11%) compared to the same point in time for Fall 2022)
Last week: 6891 (+696; +11%)
First-year/Freshman admissions: 4709 (+400; +9%) compared to the same point in time for Fall 2022)
Last week: 4697 (+383; +9%)
Orientation registrations: 1358 (+119; +9.6%) compared to the same point in time for Fall 2022)
Last week: 1326 (+135; +11.3%)
Transfer applications: 986 (-45; -4%) compared to the same point in time for Fall 2022)
Last week: 960 (-44; -4%)
Transfer admissions: 527 (-44; -8%) compared to the same point in time for Fall 2022)
Last week: 511 (-53; -9%)
Orientation registrations: 248 (-15; -5.7%) compared to the same point in time for Fall 2022)
Last week: 234 (-27; -10.3%)
Multi-year view:
|
|
Fall 2017 6/7/17 |
Fall 2018 6/6/18 |
Fall 2019 6/5/19 |
Fall 2020 6/10/20 |
Fall 2021 6/9/21 |
Fall 2022 6/8/22 |
Fall 2023 6/7/23 |
|
Freshman Applications |
6201 |
7631 |
7697 |
6226 |
6556 |
6216 |
6901 |
|
Freshman Admits |
4477 |
4935 |
4965 |
4095 |
4596 |
4309 |
4709 |
|
% incomplete apps -F |
26% |
33% |
32% |
32% |
29% |
29% |
30% |
|
Freshman Orientation Reg |
1207 |
1349 |
1365 |
1317 |
1363 |
1239 |
1358 |
|
% of admits reg for orientation |
27.0% |
27.3% |
27.5% |
32.2% |
29.7% |
28.8% |
28.8% |
|
% of final fall reg for orientation |
80.4% |
83.9% |
85.3% |
97.3% |
91.4% |
88.1 |
|
|
Final Yield - % of admits enrolled |
33% |
32% |
32% |
32% |
32% |
32% |
|
|
New Freshman fall enrollment |
1501 |
1608 |
1601 |
1354 |
1491 |
1407 |
|
|
|
|
|
|
|
|
|
|
|
Transfer Applications |
1028 |
1381 |
1211 |
1055 |
1010 |
1031 |
986 |
|
Transfer Admits |
561 |
652 |
612 |
588 |
583 |
571 |
527 |
|
% incomplete apps -T |
42% |
49% |
46% |
41% |
37% |
40% |
42% |
|
Transfer Orientation Reg |
261 |
294 |
281 |
315 |
264 |
263 |
248 |
|
% of admits reg for orientation |
46.5% |
45.1% |
45.9% |
53.6% |
45.3% |
46.1% |
47.1% |
|
% of final fall reg for orientation |
64.1% |
60.2% |
67.1% |
80.2% |
73.3% |
68.1% |
|
|
Final Yield - % of admits enrolled |
61% |
61% |
60% |
56% |
54% |
55% |
|
|
Transfer fall enrollment |
407 |
488 |
419 |
393 |
360 |
386 |
|
|
|
|
|
|
|
|
|
|
|
Point-in-Cycle - New Freshmen |
Fall 2017 |
Fall 2018 |
Fall 2019 |
Fall 2020 |
Fall 2021 |
Fall 2022 |
Fall 2023 |
|
Final total fall freshman apps |
6345 |
7791 |
7837 |
6389 |
6693 |
6340 |
|
|
% of total fall freshman apps received as of this date |
98% |
98% |
98% |
97.4% |
98.0% |
98.0% |
|
|
Final total fall freshman admits |
4591 |
5001 |
5035 |
4169 |
4670 |
4386 |
|
|
% of total freshman fall admits received as of this date |
98% |
99% |
99% |
98.2% |
98.4% |
98.2% |
|
|
Point-in-Cycle - Transfers |
Fall 2017 |
Fall 2018 |
Fall 2019 |
Fall 2020 |
Fall 2021 |
Fall 2022 |
Fall 2023 |
|
Final total fall transfer apps |
1173 |
1574 |
1363 |
1229 |
1169 |
1216 |
|
|
% of total fall transfer apps received as of this date |
88% |
88% |
89% |
86% |
86.4% |
84.8% |
|
|
Final total fall transfer admits |
668 |
801 |
702 |
701 |
672 |
700 |
|
|
% of total fall transfer admits received as of this date |
84% |
81% |
87% |
84% |
86.8% |
81.6% |
|
|
FAFSA switched to 10/1 in 2016 for those applying for fall 2017; College app/FAFSA access initiatives increased in MI in 2018-19 |
|
First able to advertise and admit to MEDP in summer 2017 for fall 2017 |
Full marketing & appl cycle for MEDP |
|
|
First fall with test blind policy fully adopted |
|
Housing application information - Another commitment indicator:
Total freshman/transfer/non-degree housing applications ($50): 1377 (gained 20 in past week)
Total freshman/transfer/non-degree advance payments ($200): 1288 (94% of total) (gained 28 in the past week)
Freshman/non-degree housing applications: 1240; advance payments: 1162 (94%)
Last year: 1097; advance payments: 1020 (93%)
Transfer housing applications: 137; Transfer advance payments: 126 (92%)
Last year: 137; advance payments: 119 (87%)
Of the 1377 total freshman, transfers and non-degree students who applied for housing, 92% have registered for orientation ($126). Another 55 started orientation registration but did not complete it (did not pay the fee) so they are not yet considered registered.
Upcoming events…
2023- 2024
Summer Counselors Visit - July 26-28, 2023 nmu.edu/admissions/counselorvisit
Wildcat Weekend – October 13 – 14, 2023
Virtual Presidential Scholars Competition – October 29-30, 2023
Presidential Scholars Competition #1 – November 5 – 6, 2023
Presidential Scholars Competition #2– November 12- 13, 2023
Wildcat Weekend – March 15 – 16, 2024
Please let me know if you have questions about anything in this report.
Gerri
Fall 2023 Weekly Application Reports - June 1, 2023
Fall 2023 Weekly Application Reports – June 1, 2023
Here are the weekly application reports comparing May 31, 2023 to June 1, 2022 for the fall semester.
A few notes about the reports:
- These numbers include Global Campus students and international students.
- Feel free to share with your NMU colleagues.
- I am happy to answer questions or talk through reports – x1464 or gdaniels@nmu.edu.
Fall 2023
First-year/Freshman applications: 6891 (+696; +11%) compared to the same point in time for Fall 2022)
Last week: 6875 (+701; +11%)
First-year/Freshman admissions: 4697 (+383; +9%) compared to the same point in time for Fall 2022)
Last week: 4687 (+388; +9%)
Orientation registrations: 1326 (+135; +11.3%) compared to the same point in time for Fall 2022)
Last week: 1292 (+133; 11.5%)
Transfer applications: 960 (-44; -4%) compared to the same point in time for Fall 2022)
Last week: 938 (-46; -5%)
Transfer admissions: 511 (-53; -9%) compared to the same point in time for Fall 2022)
Last week: 503 (-54; -10%)
Orientation registrations: 234 (-27; -10.3%) compared to the same point in time for Fall 2022)
Last week: 221 (-28; -11.2%)
Multi-year view:
|
|
Fall 2017 5/31/17 |
Fall 2018 5/30/18 |
Fall 2019 5/29/19 |
Fall 2020 6/3/20 |
Fall 2021 6/2/21 |
Fall 2022 6/1/22 |
Fall 2023 5/31/23 |
|
Freshman Applications |
6179 |
7614 |
7680 |
6210 |
6546 |
6195 |
6891 |
|
Freshman Admits |
4460 |
4926 |
4964 |
4082 |
4587 |
4304 |
4697 |
|
% incomplete apps -F |
25% |
33% |
32% |
32% |
29% |
29% |
30% |
|
Freshman Orientation Reg |
1150 |
1269 |
1327 |
1289 |
1353 |
1191 |
1326 |
|
% of admits reg for orientation |
25.8% |
25.8% |
26.7% |
31.6% |
29.5% |
27.7% |
28.2% |
|
% of final fall reg for orientation |
76.6% |
78.9% |
82.9% |
95.2% |
90.7% |
84.6% |
|
|
Final Yield - % of admits enrolled |
33% |
32% |
32% |
32% |
32% |
32% |
|
|
New Freshman fall enrollment |
1501 |
1608 |
1601 |
1354 |
1491 |
1407 |
|
|
|
|
|
|
|
|
|
|
|
Transfer Applications |
1005 |
1355 |
1193 |
1037 |
997 |
1004 |
960 |
|
Transfer Admits |
542 |
634 |
594 |
566 |
566 |
564 |
511 |
|
% incomplete apps -T |
43% |
50% |
47% |
42% |
38% |
40% |
43% |
|
Transfer Orientation Reg |
232 |
269 |
257 |
301 |
263 |
261 |
234 |
|
% of admits reg for orientation |
42.8% |
42.4% |
43.3% |
53.2% |
46.5% |
46.3% |
45.8% |
|
% of final fall reg for orientation |
57.0% |
55.1% |
61.3% |
76.6% |
73.1% |
67.6% |
|
|
Final Yield - % of admits enrolled |
61% |
61% |
60% |
56% |
54% |
55% |
|
|
Transfer fall enrollment |
407 |
488 |
419 |
393 |
360 |
386 |
|
|
|
|
||||||
|
Point-in-Cycle - New Freshmen |
Fall 2017 |
Fall 2018 |
Fall 2019 |
Fall 2020 |
Fall 2021 |
Fall 2022 |
Fall 2023 |
|
Final total fall freshman apps |
6345 |
7791 |
7837 |
6389 |
6693 |
6340 |
|
|
% of total fall freshman apps received as of this date |
97.4% |
97.7% |
98.0% |
97.0% |
97.8% |
97.7% |
|
|
Final total fall freshman admits |
4591 |
5001 |
5035 |
4169 |
4670 |
4386 |
|
|
% of total freshman fall admits received as of this date |
97.1% |
98.5% |
98.6% |
98.0% |
98.2% |
98.1% |
|
|
Point-in-Cycle - Transfers |
Fall 2017 |
Fall 2018 |
Fall 2019 |
Fall 2020 |
Fall 2021 |
Fall 2022 |
Fall 2023 |
|
Final total fall transfer apps |
1173 |
1574 |
1363 |
1229 |
1169 |
1216 |
|
|
% of total fall transfer apps received as of this date |
85.7% |
86.1% |
87.5% |
84.0% |
85.3% |
82.6% |
|
|
Final total fall transfer admits |
668 |
801 |
702 |
701 |
672 |
700 |
|
|
% of total fall transfer admits received as of this date |
81.1% |
79.2% |
84.6% |
81.0% |
84.2% |
80.6% |
|
|
FAFSA switched to 10/1 in 2016 for those applying for fall 2017; College app/FAFSA access initiatives increased in MI in 2018-19 |
|
First able to advertise and admit to MEDP in summer 2017 for fall 2017 |
Full marketing & appl cycle for MEDP |
|
|
First fall with test blind policy fully adopted |
|
Housing application information - Another commitment indicator:
Total freshman/transfer/non-degree housing applications ($50): 1357 (gained 35 in past week)
Total freshman/transfer/non-degree advance payments ($200): 1260 (93% of total) (gained 42 in the past week)
Freshman housing applications: 1222; advance payments: 1133 (93%)
Last year: 1076; advance payments: 999 (93%)
Transfer housing applications: 128; Transfer advance payments: 119 (93%)
Last year: 127; advance payments: 109 (86%)
Of the 1357 total freshman, transfers and non-degree students (7) who applied for housing, 91% have registered for orientation ($126). Another 58 started orientation registration but did not complete it (did not pay the fee) so they are not yet considered registered.
Upcoming events…
2023- 2024
Summer Counselors Visit - July 26-28, 2023 nmu.edu/admissions/counselorvisit
Wildcat Weekend – October 13 – 14, 2023
Virtual Presidential Scholars Competition – October 29-30, 2023
Presidential Scholars Competition #1 – November 5 – 6, 2023
Presidential Scholars Competition #2– November 12- 13, 2023
Wildcat Weekend – March 15 – 16, 2024
Please let me know if you have questions about anything in this report.
Gerri
Fall 2023 Weekly Application Reports - May 25 2023
Fall 2023 Weekly Application Reports - May 25, 2023
These are the weekly application reports comparing May 24, 2023 to May 25, 2022 for the fall semester.
A few notes about the reports:
- These numbers include Global Campus students and international students.
- Feel free to share with your NMU colleagues.
- We are happy to answer questions or talk through reports – x1464 or gdaniels@nmu.edu.
Fall 2023
First-year/Freshman applications: 6875 (+701; +11%) compared to the same point in time for Fall 2022)
Last week: 6845 (+690; +11%)
First-year/Freshman admissions: 4687 (+388; +9%) compared to the same point in time for Fall 2022)
Last week: 4669 (+386; +9%)
Orientation registrations: 1292 (+133; 11.5%) compared to the same point in time for Fall 2022)
Last week: 1243 (+112; +9.9%)
Transfer applications: 938 (-46; -5%) compared to the same point in time for Fall 2022)
Last week: 919 (-44; -5%)
Transfer admissions: 503 (-54; -10%) compared to the same point in time for Fall 2022)
Last week: : 490 (-46; -9%)
Orientation registrations: 221 (-28; -11.2%) compared to the same point in time for Fall 2022)
Last week: 206 (-14; -6.4%)
Multi-year view:
|
|
Fall 2017: 5/24/17 |
Fall 2018: 5/23/18 |
Fall 2019: 5/22/19 |
Fall 2020: 5/27/20 |
Fall 2021: 5/26/21 |
Fall 2022: 5/25/22 |
Fall 2023 5/24/23 |
|
Freshman Applications |
6159 |
7598 |
7669 |
6194 |
6526 |
6174 |
6875 |
|
Freshman Admits |
4456 |
4924 |
4956 |
4075 |
4580 |
4299 |
4687 |
|
% incomplete apps -F |
25% |
33% |
32% |
32% |
28% |
29% |
30% |
|
Freshman Orientation Reg |
1103 |
1227 |
1297 |
1185 |
1324 |
1159 |
1292 |
|
% of admits reg for orientation |
24.8% |
24.9% |
26.2% |
29.1% |
28.9% |
26.90% |
27.6% |
|
% of final fall reg for orientation |
73.5% |
76.3% |
81.0% |
87.5% |
88.8% |
82.4% |
|
|
Final Yield - % of admits enrolled |
33% |
32% |
32% |
32% |
32% |
32% |
|
|
New Freshman fall enrollment |
1501 |
1608 |
1601 |
1354 |
1491 |
1407 |
|
|
|
|
|
|
|
|
|
|
|
Transfer Applications |
987 |
1332 |
1174 |
1010 |
972 |
984 |
938 |
|
Transfer Admits |
528 |
617 |
576 |
545 |
555 |
557 |
503 |
|
% incomplete apps -T |
44% |
50% |
48% |
43% |
38% |
39% |
43% |
|
Transfer Orientation Reg |
212 |
252 |
240 |
267 |
251 |
249 |
221 |
|
% of admits reg for orientation |
40.2% |
40.8% |
41.7% |
49.0% |
45.2% |
44.70% |
43.9% |
|
% of final fall reg for orientation |
52.1% |
51.6% |
57.3% |
67.9% |
69.7% |
64.5% |
|
|
Final Yield - % of admits enrolled |
61% |
61% |
60% |
56% |
54% |
55% |
|
|
Transfer fall enrollment |
407 |
488 |
419 |
393 |
360 |
386 |
|
|
|
|
||||||
|
Point-in-Cycle - New Freshmen |
Fall 2017 |
Fall 2018 |
Fall 2019 |
Fall 2020 |
Fall 2021 |
Fall 2022 |
Fall 2023 |
|
Final total fall freshman apps |
6345 |
7791 |
7837 |
6389 |
6693 |
6340 |
|
|
% of total fall freshman apps received as of this date |
97% |
98% |
98% |
97.0% |
97.5% |
97.4% |
|
|
Final total fall freshman admits |
4591 |
5001 |
5035 |
4169 |
4670 |
4386 |
|
|
% of total freshman fall admits received as of this date |
97% |
98% |
98% |
98.0% |
98.1% |
98.0% |
|
|
Point-in-Cycle - Transfers |
Fall 2017 |
Fall 2018 |
Fall 2019 |
Fall 2020 |
Fall 2021 |
Fall 2022 |
Fall 2023 |
|
Final total fall transfer apps |
1173 |
1574 |
1363 |
1229 |
1169 |
1216 |
|
|
% of total fall transfer apps received as of this date |
84% |
85% |
86% |
82.2% |
83.1% |
80.9% |
|
|
Final total fall transfer admits |
668 |
801 |
702 |
701 |
672 |
700 |
|
|
% of total fall transfer admits received as of this date |
79% |
77% |
82% |
77.7% |
82.6% |
79.6% |
|
|
FAFSA switched to 10/1 in 2016 for those applying for fall 2017; College app/FAFSA access initiatives increased in MI in 2018-19 |
|
First able to advertise and admit to MEDP in summer 2017 for fall 2017 |
Full marketing & appl cycle for MEDP |
|
|
First fall with test blind policy fully adopted |
|
Housing application information - Another commitment indicator:
Total freshman/transfer housing applications ($50): 1316 (gained 61 in past week)
Total freshman/transfer advance payments ($200): 1218 (92% of total) (gained 101 in the past week)
Freshman housing applications: 1195; advance payments: 1105 (92%)
Last year: 1062; advance payments: 979 (92%)
Transfer housing applications: 130; Transfer advance payments: 113 (87%)
Last year: 118; advance payments: 101 (86%)
Of the 1322 total freshman, transfers and non-degree students (6) who applied for housing, 90% have registered for orientation ($126). Another 68 started orientation registration but did not complete it (did not pay the fee) so they are not yet considered registered.
Please let us know if you have questions about anything in this report.
Gerri
Fall 2023 Weekly Application Reports - May 18, 2023
Fall 2023 Weekly Application Reports - May 18, 2023
Hello, Everyone,
Here are the weekly application reports comparing May 17, 2023 to May 18, 2022 for the fall semester.
A few notes about the reports:
- These numbers include Global Campus students and international students.
- Feel free to share with your NMU colleagues.
- I am happy to answer questions or talk through reports – x1464 or gdaniels@nmu.edu.
- View the reports here.
Fall 2023
First-year/Freshman applications: 6845 (+690; +11%) compared to the same point in time for Fall 2022)
Last week: 6822 (+695; +11%)
First-year/Freshman admissions: 4669 (+386; +9%) compared to the same point in time for Fall 2022)
Last week: 4649 (+373; +9%)
Orientation registrations: 1243 (+112; +9.9%) compared to the same point in time for Fall 2022)
Last week: 1196 (+114; +10.5%)
Transfer applications: 919 (-44; -5%) compared to the same point in time for Fall 2022)
Last week: 899 (-23; -2%)
Transfer admissions: 490 (-46; -9%) compared to the same point in time for Fall 2022)
Last week: : 476 (-32; -6%)
Orientation registrations: 206 (-14; -6.4%) compared to the same point in time for Fall 2022)
Last week: 190 (-11; -5.5%)
Multi-year view:
|
|
Fall 2017: 5/17/17 |
Fall 2018: 5/16/18 |
Fall 2019: 5/15/19 |
Fall 2020: 5/20/20 |
Fall 2021: 5/19/21 |
Fall 2022: 5/18/22 |
Fall 2023 5/17/23 |
|
Freshman Applications |
6133 |
7575 |
7645 |
6175 |
6506 |
6155 |
6845 |
|
Freshman Admits |
4445 |
4908 |
4936 |
4075 |
4571 |
4284 |
4669 |
|
% incomplete apps -F |
25% |
33% |
33% |
32% |
28% |
29% |
30% |
|
Freshman Orientation Reg |
1060 |
1169 |
1253 |
1125 |
1275 |
1131 |
1243 |
|
% of admits reg for orientation |
23.8% |
23.8% |
25.4% |
27.6% |
27.9% |
26.4% |
26.6% |
|
% of final fall reg for orientation |
70.6% |
72.7% |
78.3% |
83.1% |
85.5% |
80.4% |
|
|
Final Yield - % of admits enrolled |
33% |
32% |
32% |
32% |
32% |
32% |
|
|
New Freshman fall enrollment |
1501 |
1608 |
1601 |
1354 |
1491 |
1407 |
|
|
|
|
|
|
|
|
|
|
|
Transfer Applications |
961 |
1293 |
1156 |
990 |
939 |
963 |
919 |
|
Transfer Admits |
500 |
590 |
553 |
525 |
539 |
536 |
490 |
|
% incomplete apps -T |
45% |
51% |
50% |
44% |
38% |
40% |
43% |
|
Transfer Orientation Reg |
196 |
233 |
226 |
236 |
230 |
220 |
206 |
|
% of admits reg for orientation |
39.2% |
39.5% |
40.9% |
45.0% |
42.7% |
41.0% |
42.0% |
|
% of final fall reg for orientation |
48.2% |
47.7% |
53.9% |
60.1% |
63.9% |
57.0% |
|
|
Final Yield - % of admits enrolled |
61% |
61% |
60% |
56% |
54% |
55% |
|
|
Transfer fall enrollment |
407 |
488 |
419 |
393 |
360 |
386 |
|
|
Point-in-Cycle - New Freshmen |
Fall 2017 |
Fall 2018 |
Fall 2019 |
Fall 2020 |
Fall 2021 |
Fall 2022 |
Fall 2023 |
|
Final total fall freshman apps |
6345 |
7791 |
7837 |
6389 |
6693 |
6340 |
|
|
% of total fall freshman apps received as of this date |
97% |
97% |
98% |
97.0% |
97.2% |
97.1% |
|
|
Final total fall freshman admits |
4591 |
5001 |
5035 |
4169 |
4670 |
4386 |
|
|
% of total freshman fall admits received as of this date |
97% |
98% |
98% |
98.0% |
97.9% |
97.7% |
|
|
Point-in-Cycle - Transfers |
Fall 2017 |
Fall 2018 |
Fall 2019 |
Fall 2020 |
Fall 2021 |
Fall 2022 |
Fall 2023 |
|
Final total fall transfer apps |
1173 |
1574 |
1363 |
1229 |
1169 |
1216 |
|
|
% of total fall transfer apps received as of this date |
82% |
82% |
85% |
81.0% |
80.3% |
79.2% |
|
|
Final total fall transfer admits |
668 |
801 |
702 |
701 |
672 |
700 |
|
|
% of total fall transfer admits received as of this date |
75% |
74% |
79% |
75.0% |
80.2% |
76.6% |
|
|
FAFSA switched to 10/1 in 2016 for those applying for fall 2017; College app/FAFSA access initiatives increased in MI in 2018-19 |
|
First able to advertise and admit to MEDP in summer 2017 for fall 2017 |
Full marketing & app cycle for MEDP |
|
|
First fall with test blind policy fully adopted |
|
Housing application information - Another commitment indicator:
Total freshman/transfer housing applications ($50): 1255 (gained 17 in past week)
Total freshman/transfer advance payments ($200): 1117 (89% of total) (gained 48 in the past week)
Freshman housing applications: 1150; advance payments: 1027 (89%)
Last year: 1045; advance payments: 954 (90%)
Transfer housing applications: 105; Transfer advance payments: 90 (86%)
Last year: 109; advance payments: 96 (88%)
Of the 1260 total freshman, transfers and non-degree students (5) who applied for housing, 88% have registered for orientation ($126). Another 79 started orientation registration but did not complete it (did not pay the fee) so they are not yet considered registered.
Please let me know if you have questions about anything in this report.